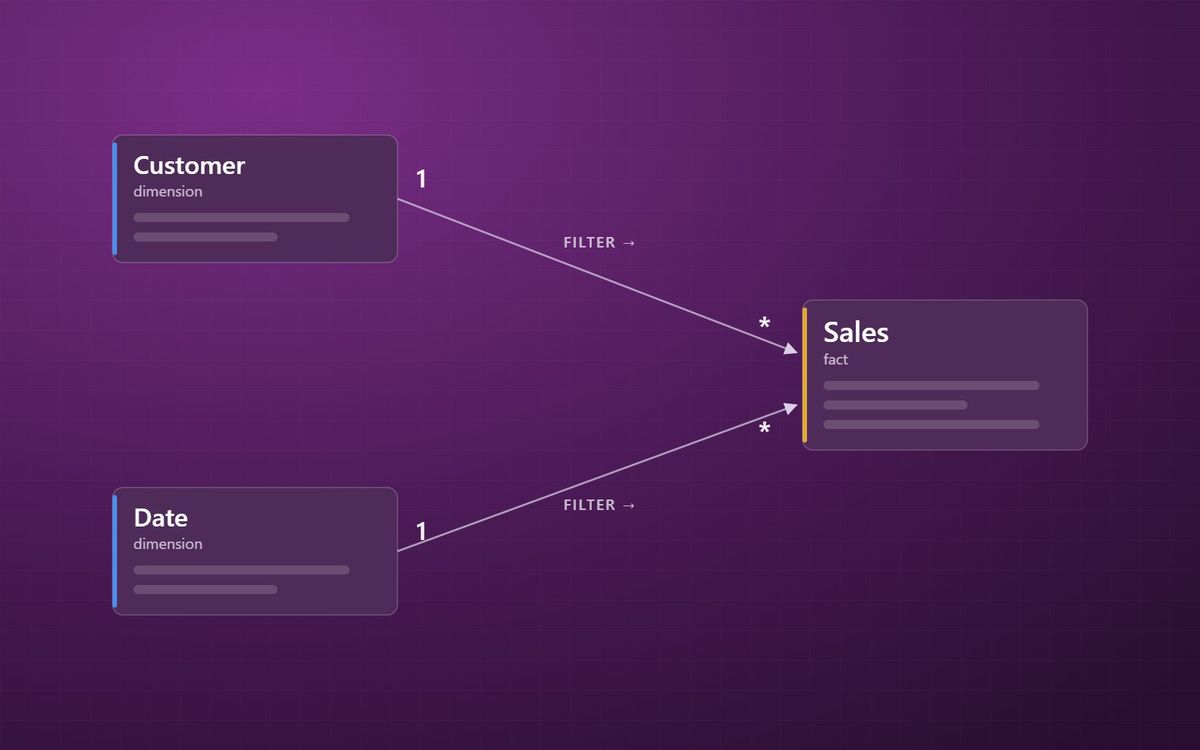
Relationships decide how a filter on one table reaches another. Get cardinality and filter direction right and a model behaves predictably. Get them wrong and totals quietly change.
The earlier posts in this series built up the pieces of a reporting model: why the source shape is wrong, the star schema, grain, slowly changing dimensions and the date table. This final post covers what joins them together in Power BI: relationships.
What a relationship does
A relationship in Power BI connects a column in one table to a column in another, usually a dimension's key to the matching key in a fact table. Its real job is to carry filters. When someone selects a region, the relationship passes that selection from the customer table to the sales table, and the numbers change.
Every relationship has two settings that matter: cardinality and cross-filter direction.
Cardinality
Cardinality describes how many rows on each side match.
- One-to-many is the normal case. One customer has many sales. The "one" side is the dimension, with a unique key. The "many" side is the fact. In a good star schema almost every relationship is this type.
- One-to-one means each row matches exactly one row on the other side. It usually signals two tables that should be combined into one.
- Many-to-many means neither side has unique values. Power BI supports it, but it needs care, because it can produce totals that do not add up the way people expect.
If Power BI insists a relationship is many-to-many when you expected one-to-many, treat it as a warning. It usually means duplicate keys in a dimension, often from a data quality problem upstream. It is worth fixing at source, in line with treating data quality as a habit rather than a project.
Cross-filter direction
Direction decides which way filters travel.
- Single direction: filters flow from the dimension to the fact. Select a product and sales filter. This is the default and the right choice almost everywhere.
- Both directions: filters also flow back from the fact to the dimension, and on to other dimensions. It can be useful, for example to show only customers who bought a selected product, but it slows models down and can create ambiguous paths where a filter could reach a table by two routes.
Our rule of thumb: start with single direction everywhere, and switch on both directions only for a specific, understood reason. Where you only need it for one calculation, do it inside that measure rather than on the relationship. The same care applies when relationships interact with row-level security.
Active and inactive relationships
Power BI allows only one active path between two tables. If a fact table has an order date and a ship date, both linked to the date table, only one of those relationships can be active. The other is inactive and is used only when a measure asks for it. This is the role-playing pattern described in the date table post.
Bridge tables for genuine many-to-many
Some relationships really are many-to-many. A customer can belong to several marketing segments. A project can have several cost centres. The clean pattern is a bridge table in the middle: one row per valid pairing, with one-to-many relationships on either side.
Bridge tables make the logic explicit and keep totals honest, though they need clear labelling, because a customer in two segments will correctly appear in both segment totals but only once in the grand total.
A quick relationship health check
- Is almost every relationship one-to-many, from dimension to fact?
- Are both-direction filters rare, and can you explain each one?
- Are any many-to-many relationships intentional?
- Do dimension keys have no duplicates and no blanks?
If your model fails these, it is probably producing numbers that are hard to explain. It is one of the first areas we check in a free audit, and good relationship design is part of every Power BI model we build.
Where the series leaves you
Six posts in, you have the core of data modelling: reshape the source, build a star, declare the grain, keep history honest, share one date table, and connect it all with simple relationships. None of it is glamorous. All of it decides whether people trust the numbers enough to act on them. If you want help putting it into practice, our Analytics Acceleration Programme is built for exactly that.
Simple relationships make a model predictable, and a predictable model is one people trust.
Simon Devine
Founder, Hopton Analytics
Part of the Hopton Analytics team, delivering governed analytics programmes for UK mid-market organisations.