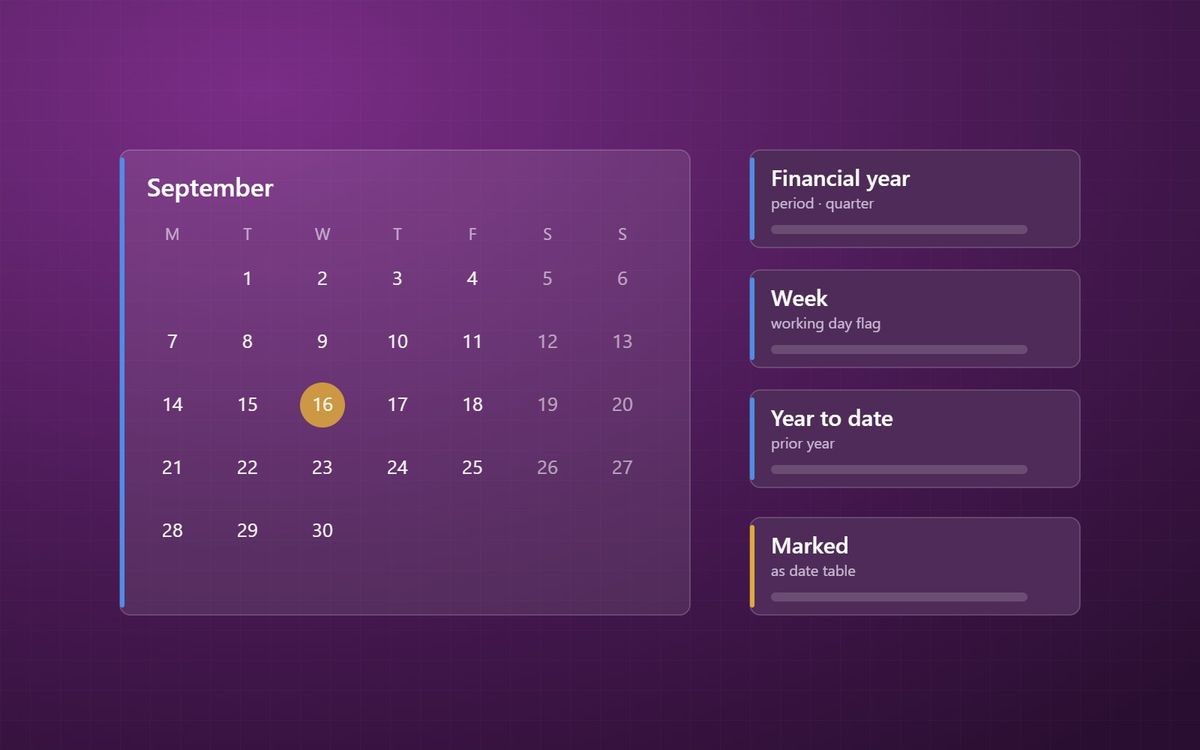
Time is in almost every business question. A proper date table makes financial years, prior-year comparisons and year-to-date totals simple, and turning off auto date/time makes models smaller.
Nearly every business question has time in it. This month against last month. Year to date against budget. This quarter against the same quarter last year. The table that makes those questions easy is the date table, and it is the one dimension almost every model shares.
This is the fifth post in our data modelling basics series, after slowly changing dimensions.
What a date table is
A date table is a dimension with one row per calendar day. It covers every day in the range your data needs, with no gaps, and usually runs from the start of the earliest year to the end of the latest.
Each row describes that day in all the ways the business talks about time:
- Date, day of week, and whether it is a working day.
- Week, month, quarter and calendar year.
- Financial year, financial quarter and financial period, if your year does not start in January.
- Sort columns, so that months appear January to December rather than alphabetically.
- Useful flags, such as current month, previous month or year to date.
Fact tables then link to it through their date columns. Every visual that slices by time uses the same definitions.
Why not just use the date column in the fact table?
Power BI's auto date/time option quietly creates a hidden date table for every date column in the model. It is convenient for a quick report and costly for a real model. Each hidden table takes space, none of them know your financial year, and they cannot be shared across fact tables.
Turning auto date/time off and using one proper date table gives you a smaller model, consistent definitions, and the ability to put sales, budget and stock on one timeline. It is one of the first changes we make when reviewing a slow Power BI model.
Mark it as a date table
Once built, mark the table as a date table in Power BI. That tells the engine which column holds the dates and lets time intelligence calculations such as year to date and same period last year work reliably. Those calculations expect a complete, contiguous set of dates, which is another reason not to rely on dates taken from the transactions themselves.
Many retailers and some manufacturers report on 4-4-5 or 52/53-week years rather than calendar months. The standard time intelligence functions assume calendar months, so those businesses need extra columns in the date table and some care in the calculations. Microsoft has added calendar-based time intelligence to help with this, but the date table still needs to hold the right periods.
One table, several dates
Most fact tables have more than one date. An order has an order date, a promised date and a shipped date. This is called a role-playing dimension: one date table playing several roles.
There are two common ways to handle it:
- One date table with one active relationship and further inactive relationships, switched on in specific measures. Tidy, but report builders need to know which measure uses which date.
- A separate copy of the date table for each role, such as Order Date and Ship Date. More tables, but much clearer for self-service users.
We tend to favour clarity for models that many people will build reports on. How relationships like these behave is the subject of the final post in this series.
Build it once
The date table should be built once, in the data platform or as a shared table in the semantic model, and reused everywhere. Financial year definitions belong to finance, not to whoever built this month's report. Our Power BI team includes a standard date table in every model, and the Power BI FAQs cover more of the common questions.
Time is in every question, so it deserves one table that everyone agrees on.
Simon Devine
Founder, Hopton Analytics
Part of the Hopton Analytics team, delivering governed analytics programmes for UK mid-market organisations.