Business Central, Salesforce and every other operational system store data in a shape built for writing, not reading. Reporting needs a different shape, and that is what data modelling is for.
This is the first post in a short series on the basics of data modelling. It starts with a question that sounds too simple to ask: if the data is already in a database, why can't we just report on it?
The answer is shape. Operational systems such as Business Central, Salesforce or a bespoke order system hold the right data in the wrong shape for analysis. Understanding why is the first step to understanding everything else in data modelling.
Operational systems are built to record, not to answer
An ERP or CRM has one main job: capture transactions quickly and correctly. Every time someone raises an invoice, books stock or updates a customer, the system has to write that change once, in one place, without contradicting anything else.
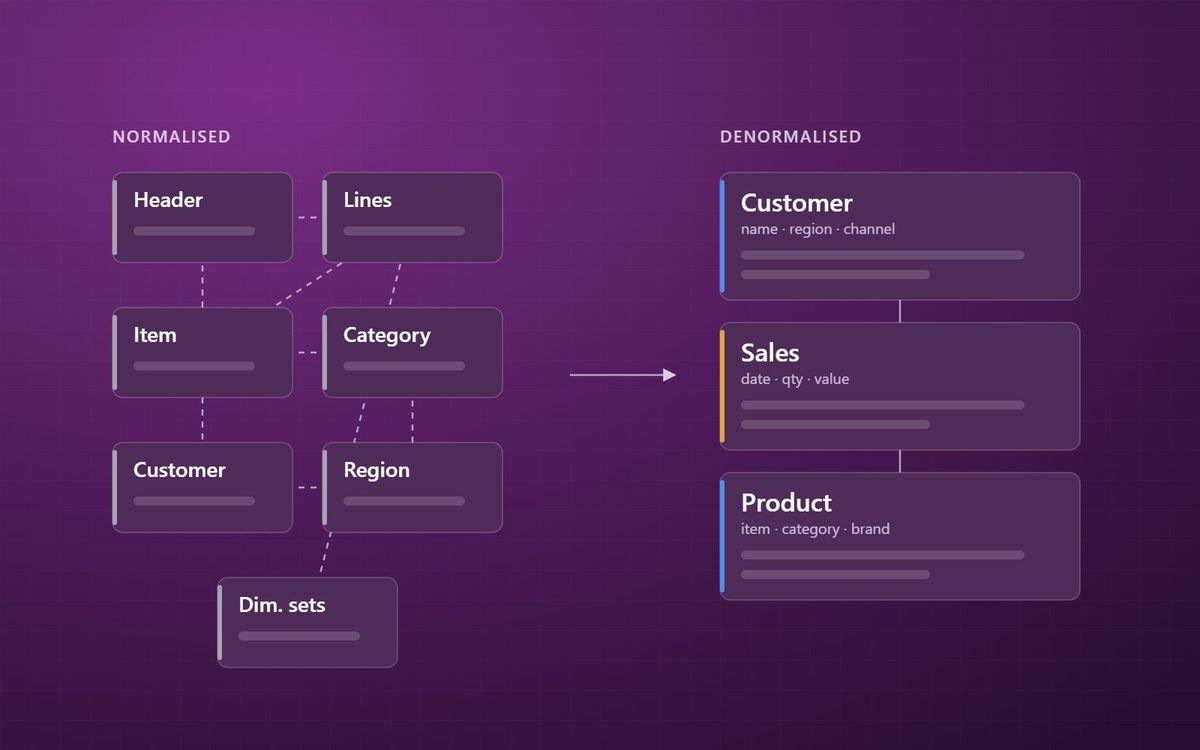
The design that achieves this is called normalisation. Data is split into many narrow tables, each describing one thing, linked by keys. A customer's address lives in one table. Their payment terms live in another. An invoice is split into a header table and a line table, and the line points at an item table, which points at an item category table.
Nothing is repeated. If a customer moves, one row changes and every invoice that refers to them is automatically correct. For recording transactions, it is exactly the right design.
Why that shape hurts reporting
Now ask a simple business question: what did we sell last quarter, by region and product category, compared with the same quarter last year?
In a normalised system, answering it means joining the invoice header to the invoice lines, the lines to items, items to categories, the header to customers, customers to regions, and then working out which dates count as last quarter. Business Central adds its own layer on top, with dimension set entries that hold analysis codes such as department or project in a separate structure.
Every report that asks a similar question has to rebuild those joins. Different people rebuild them slightly differently. That is one of the most common reasons Power BI reports disagree with each other, and a frequent cause of slow reports.
Denormalising: reshaping for questions
Reporting models deliberately go the other way. They denormalise: they flatten related tables together so that everything you need to describe a thing sits in one place.
The customer, their region, their sales channel and their account manager become one wide customer table. Item, category and brand become one product table. The transactions themselves become a long, narrow table of numbers with keys pointing at those descriptive tables.
Some values are now repeated. The region name appears on every customer in that region. That is fine. Reporting tools read far more than they write, and modern engines such as the one behind Power BI compress repeated values extremely well. The result is fewer joins, simpler logic, faster queries and one agreed version of each definition.
Where the reshaping happens
The reshaping should happen once, upstream, not inside every report. In a modern Microsoft estate that usually means:
- Landing the raw source data untouched, as covered in our post on the Bronze, Silver and Gold layers.
- Cleaning and conforming it, so a customer is a customer regardless of which system it came from.
- Building the reporting shape in the Gold layer or a data warehouse, ready for a Power BI semantic model to sit on top.
If you are on Business Central, our Business Central analytics work follows exactly this pattern.
What comes next
The reporting shape that almost every well-built Power BI model uses has a name: the star schema. It is the subject of the next post in this series. After that we cover grain, slowly changing dimensions, the date table and relationships.
If you want to know how far your current reports are from that shape, a free audit is a quick way to find out.
Source systems are built to remember what happened. Reporting models are built to explain it.
Simon Devine
Founder, Hopton Analytics
Part of the Hopton Analytics team, delivering governed analytics programmes for UK mid-market organisations.