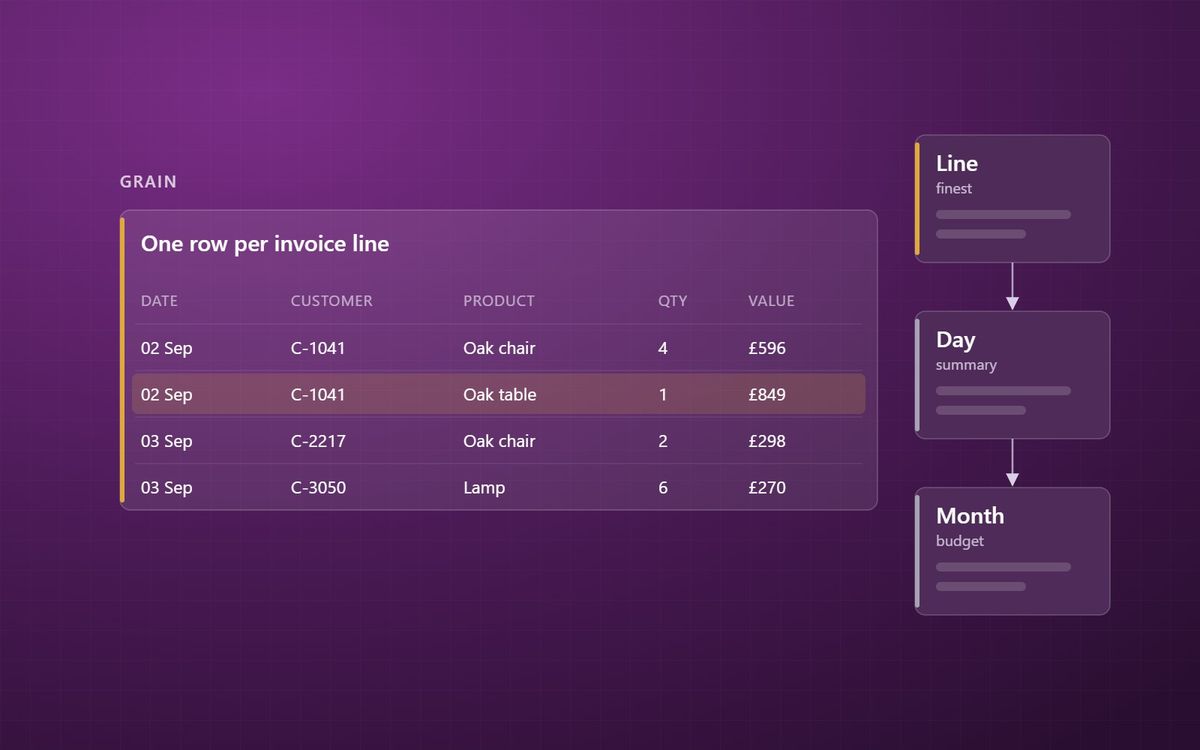
Before you choose a single column, decide what one row means. Get the grain wrong and totals double count, budgets refuse to line up with actuals, and nobody quite trusts the numbers.
In the previous post we described the star schema: facts in the middle, dimensions around the edge. Before you build a fact table, though, there is one decision that shapes everything else. What does one row mean?
That decision is called the grain. It is the most important sentence in any data model, and it is surprisingly often never written down.
What grain means
The grain of a fact table is the level of detail a single row represents. Written plainly, it sounds like this:
- One row per invoice line.
- One row per product, per store, per day.
- One row per employee timesheet entry.
- One row per GL account, per cost centre, per month.
Each of those is a different table, with different uses. The first can tell you which customer bought which product at what price. The last can tell you how spend tracked against budget, but nothing about individual transactions.
Declare it before choosing columns
The grain comes first because it decides which dimensions are allowed. If the grain is one row per invoice line, customer, product and date all make sense. If the grain is one row per product per month, a customer dimension makes no sense at all, because a row does not belong to one customer.
The classic advice is to choose the lowest grain the source can provide. Detailed data can always be added up. Summarised data can never be broken back down. If you only store monthly totals, the first time someone asks about a specific week you are back at the source system.
What goes wrong when grain is mixed
Most double counting in reporting comes from mixed grain. A common example: an order header value is copied onto every order line so it is "handy". Sum the column and the header value is counted once per line. A three-line order with £300 of freight now shows £900.
Another example is a table that holds both individual transactions and subtotal rows. Any visual that adds them up gets roughly double the real number. These errors are rarely obvious. They produce numbers that look plausible, which is worse than numbers that look wrong. It is one reason a pipeline can succeed while the data is still wrong.
The fix is always the same: one grain per fact table. Header-level values such as freight either get allocated down to lines by an agreed rule, or they live in their own header-level fact table.
Budgets and actuals: different grains, one model
Budgets are the most common grain clash. Actual sales are recorded per invoice line, per day. The budget is usually set per product category, per region, per month.
Forcing them into one table never works cleanly. The right pattern is two fact tables:
- A sales fact at invoice line grain.
- A budget fact at category, region and month grain.
Both connect to shared dimensions. Budget connects to date at month level and to product at category level. Power BI then compares the two at the level they have in common. This is exactly why conformed dimensions matter, and it is the basis of most of the finance reporting and FP&A work we do.
A quick grain check for existing reports
If you suspect grain problems in an existing model, ask three questions of each fact table:
- 1Can someone state in one sentence what one row means?
- 2Does every column describe something at that level, not above it?
- 3Does summing each numeric column give a total that matches the source system?
If any answer is no, that table is a likely source of numbers people argue about. A quick outside view, such as our free audit, usually finds these early.
Next in the series
Grain tells you what a row in a fact table means. The next post looks at the other side of the star: what happens when the things in your dimensions change over time, and how slowly changing dimensions keep history honest.
Decide what one row means, write it down, and hold every column to it.
Simon Devine
Founder, Hopton Analytics
Part of the Hopton Analytics team, delivering governed analytics programmes for UK mid-market organisations.