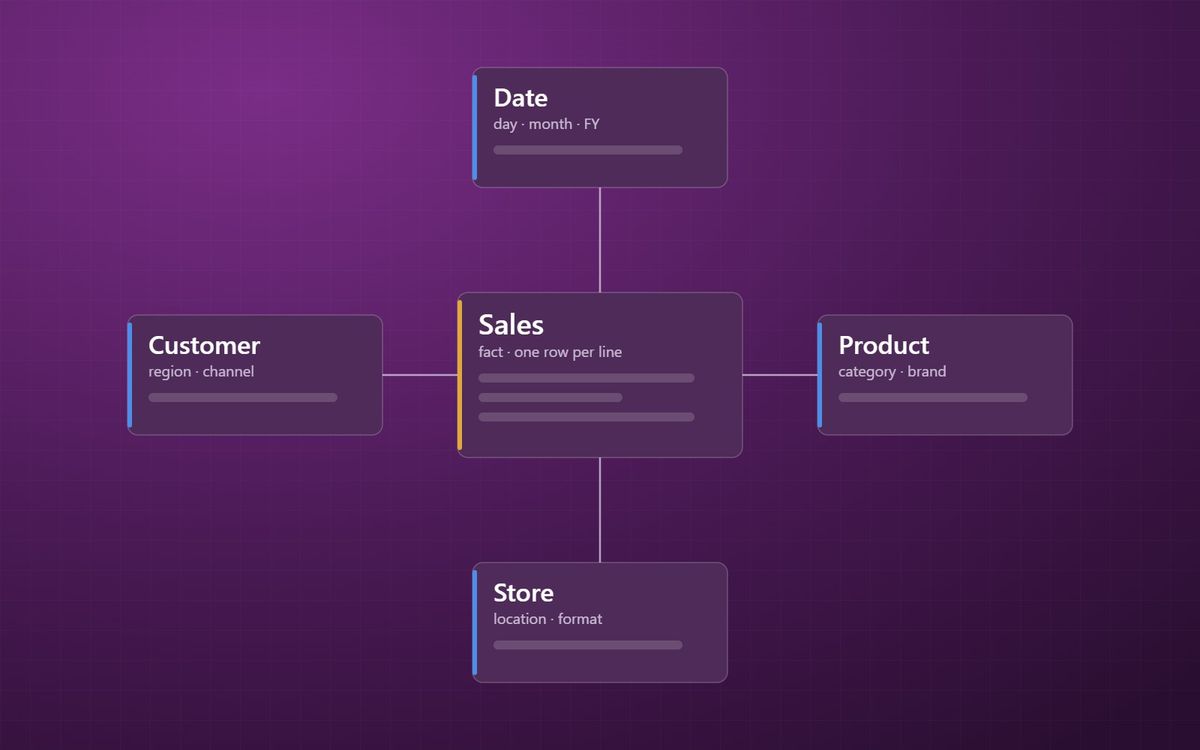
One table of events in the middle, descriptive tables around the edge. The star schema is the single most useful idea in reporting data modelling, and Power BI is built around it.
If you only learn one idea in data modelling, make it the star schema. It is the shape Microsoft recommends for Power BI, the shape its engine is optimised for, and the shape that makes reports simple to build and hard to get wrong.
The previous post in this series explained why source systems are the wrong shape for reporting. This one explains the right shape.
Two kinds of table
A star schema has only two kinds of table.
- Fact tables record events or measurements. A sales line, a stock movement, a timesheet entry, a website visit. They are long and narrow: lots of rows, mostly numbers and keys.
- Dimension tables describe the things involved in those events. Customer, product, employee, store, date. They are shorter and wider: fewer rows, lots of descriptive text columns.
Put the fact table in the middle and the dimensions around it, each joined by a single key, and the diagram looks like a star. That is the whole idea.
A worked example
Take sales. The fact table holds one row per invoice line: date key, customer key, product key, store key, quantity, net value and cost.
Around it sit four dimensions. Customer holds name, region, channel and account manager. Product holds description, category, brand and size. Store holds location and format. Date holds day, week, month, quarter and financial year.
Now every question is the same pattern. Filter or group by columns in the dimensions, then add up numbers in the fact. Sales by region, margin by brand, quantity by financial week: the model does not care which, because the structure is identical.
Why Power BI prefers it
Power BI's engine stores data in columns and compresses them. Dimension columns with repeated values compress very well, and fact tables made of numbers and keys scan very fast. Filters flow naturally from each dimension to the fact through a one-to-many relationship.
The alternatives cost you. One huge flat table repeats every descriptive column on every row, bloats the model and makes some calculations awkward. A snowflake, where dimensions are split into further sub-tables, adds joins that the engine then has to walk. And a model that mirrors the source system, with dozens of linked tables, produces ambiguous filter paths and reports that disagree.
A star is also easier for people to use. Business users, and increasingly Copilot and AI agents, find it much easier to navigate a model where every table is either a thing or an event. That is part of why the semantic model has become more important, not less.
Conformed dimensions: stars that share
Most businesses need more than one fact table. Sales, purchases, stock and budget are different processes. The trick is to let them share the same dimensions.
When sales and budget both use the same product and date dimensions, you can put them side by side in one visual without any clever logic. These shared tables are called conformed dimensions, and they are what turns a set of separate reports into one coherent model. They matter even more when consolidating several Business Central companies into one model.
Common mistakes
- Putting descriptive text in the fact table because it was easier at the time.
- Leaving dimensions snowflaked because that is how the source system stored them.
- Mixing different levels of detail in one fact table. That one is serious enough to get its own post on grain.
- Building the star separately inside every report rather than once in a shared semantic model.
Where it lives
In a Fabric estate, the star schema is normally built in the Gold layer of a lakehouse or warehouse, and the Power BI semantic model sits directly on top of it. Our Power BI and data platform teams build to this pattern by default.
Every table is either a thing or an event. Keep it that way and most reporting problems never start.
Simon Devine
Founder, Hopton Analytics
Part of the Hopton Analytics team, delivering governed analytics programmes for UK mid-market organisations.