Dataflow Gen2 in Microsoft Fabric can now write a finished Excel workbook to SharePoint on every refresh. What the file can contain, who it helps, and what to check before finance relies on it.
Microsoft has given Dataflow Gen2 in Fabric a new job. A dataflow can now write a finished Excel workbook to a file destination, such as SharePoint or OneDrive, every time it refreshes. A title, a short summary, styled tables, charts, and one sheet per region if you want it.
If you fill Excel with data from dataflows today, this changes who does the work. The dataflow does it, and the person who needs the numbers just opens the file.
What has changed?
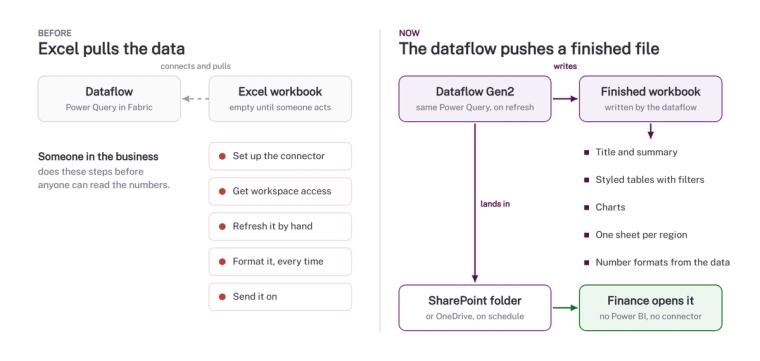
Until now, getting Power Query results into Excel was a pull. Excel had to connect to the dataflow, pull the tables in, and someone had to refresh it and format it by hand. That someone needed the right connector, the right workspace access and a bit of patience.
With the Excel output in Dataflow Gen2 it works the other way round. The dataflow pushes a finished file to the place people already look, on the same schedule as the rest of your refreshes. It is the same Power Query you already know. The new part is where the file lands, and who no longer has to do anything to get it.
What can the Excel file contain?
The output is a proper workbook, not a data dump. It can include:
- a title and summary text at the top of a sheet
- formatted Excel tables with filters and a choice of table styles
- plain ranges for headings, notes or totals
- charts, including column, bar, line, pie and doughnut, built from the data in the workbook
- several sheets in one workbook, or one sheet for each value in a column, such as region, branch or cost centre
- number formats that follow the Power Query data type, so currency, percentages and dates come through as numbers rather than text
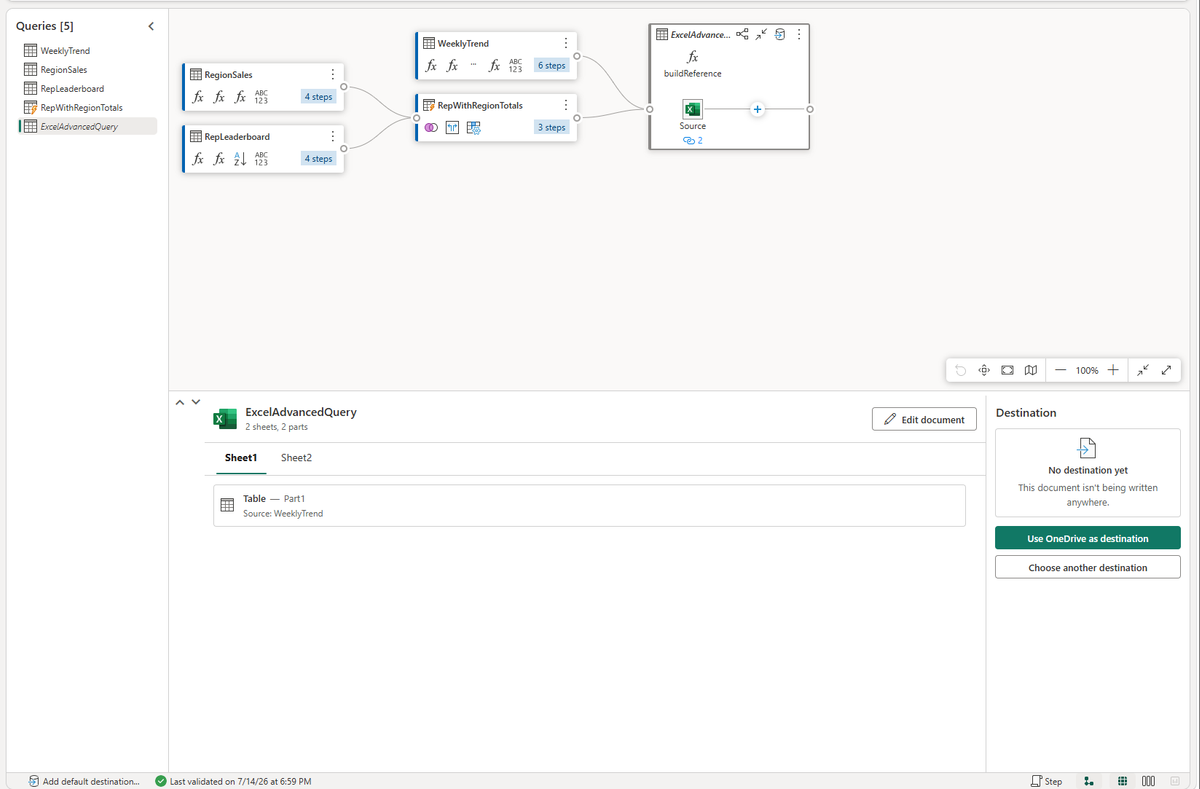
There are three ways to set it up. Single sheet writes one table or one chart. Multi sheet splits the data across sheets by a column you choose. Advanced gives full control, either through the visual Excel document builder or by writing a navigation table in Power Query that describes each sheet and each part. Chris Webb has a good worked example of the advanced route, including a summary written by AI.
Who does this help?
The person who gains most is the one who never opens Power BI. A finance manager, a regional lead or a board member finds a file in a SharePoint folder and opens it. There is no connector to configure, no workspace access to grant and no refresh button to press.
It also helps the team that builds the data. The logic stays in one place. The same Power Query that feeds your lakehouse or your semantic model can produce the Excel pack, so the numbers in the spreadsheet match the numbers in the report. That matters more than it sounds. Most arguments about whose number is right start with a spreadsheet someone rebuilt by hand, which is exactly the problem we describe in why finance rebuilds the report in Excel.
Does it replace Power BI?
No. Interactive analysis, drill-down, row-level security and Copilot over a semantic model still belong in Power BI. The Excel output is for the regular, structured pack that people want as a file: weekly sales by region, the month-end debtors list, the stock position each branch manager checks on a Monday morning.
If your team already exports from Power BI to Excel every week and then tidies it up, that is the first job to move.
What should you check before relying on it?
- It is in preview. Microsoft lists the Excel document builder as a preview feature, so test it on a pack that is not business-critical and expect it to change.
- It needs a file destination. The Excel output writes to file-based destinations such as SharePoint, OneDrive or the Files area of a lakehouse. It cannot write to a table.
- Errors stop the file. Cell-level errors in the data cause the workbook to fail, so fix errors upstream in the dataflow rather than hoping they pass through.
- Excel limits still apply: 1,048,576 rows per sheet, sheet names of up to 31 characters, and no dates before 1900.
- Permissions move to the folder. Whoever can open the SharePoint folder can read the file, so set access on that folder as deliberately as you would on a workspace.
- Check the formatting before the first send. Formats follow the data type, so look at how dates and numbers appear before the file goes to finance.
How would we start?
Pick one recurring Excel pack that someone builds by hand today. Rebuild it as a Dataflow Gen2 output, write it to the SharePoint folder where people already look, and run both side by side for a month. If the numbers match and nobody misses the manual version, switch the manual one off.
It is a small change that removes a weekly chore and a common source of mismatched numbers. If you want help deciding which of your Excel packs to move first, or how this fits the rest of your Microsoft Fabric platform, talk to us.
Microsoft documents the feature in Use the Excel document builder in Dataflow Gen2 and Creating Excel documents with navigation tables.
Related reading
- Microsoft Fabric consultancy
- How do you automate ETL for Power BI reporting? The pattern that replaces manual refreshes and Excel exports
- When to use shortcuts, mirroring, pipelines or dataflows: a decision guide for Fabric data integration
- Business Central dimensions in Power BI: why finance rebuilds the report in Excel, and the model that stops it
- Azure Data Factory vs Fabric Data Factory pipelines: what is different, and which to use in 2026
James Morley
Analytics Solutions Consultant
Part of the Hopton Analytics team, delivering governed analytics programmes for UK mid-market organisations.