A sales rep moves region and suddenly last year's regional figures change. Slowly changing dimensions are how a data model decides whether history should move with them.
Here is a problem most finance teams have met. A customer moves from the North region to the South region. The next month, someone reruns last year's regional sales report and the numbers have changed. Nothing was wrong with last year. The data model simply rewrote it.
This is what slowly changing dimensions deal with. It is the fourth post in our data modelling series, following grain.
Why dimensions change
Dimensions describe the things in your business: customers, products, employees, stores. Those things change, but slowly. A customer changes region. A product moves category. An employee changes team. A store is re-graded.
Each time, the model has to decide: should historic transactions follow the new value, or stay with the value that was true at the time? There is no single right answer. It depends on the question.
Type 1: overwrite
The simplest approach is to overwrite the old value. The customer's region is updated from North to South, and every transaction for that customer, past and present, now reports under South.
Type 1 is right when the old value was a mistake, or when history genuinely does not matter. Correcting a misspelt name, fixing a wrong postcode, or reporting on the current account manager's full book of business are all Type 1 cases.
It is cheap and simple. Its weakness is that history quietly changes.
Type 2: keep a new row for each version
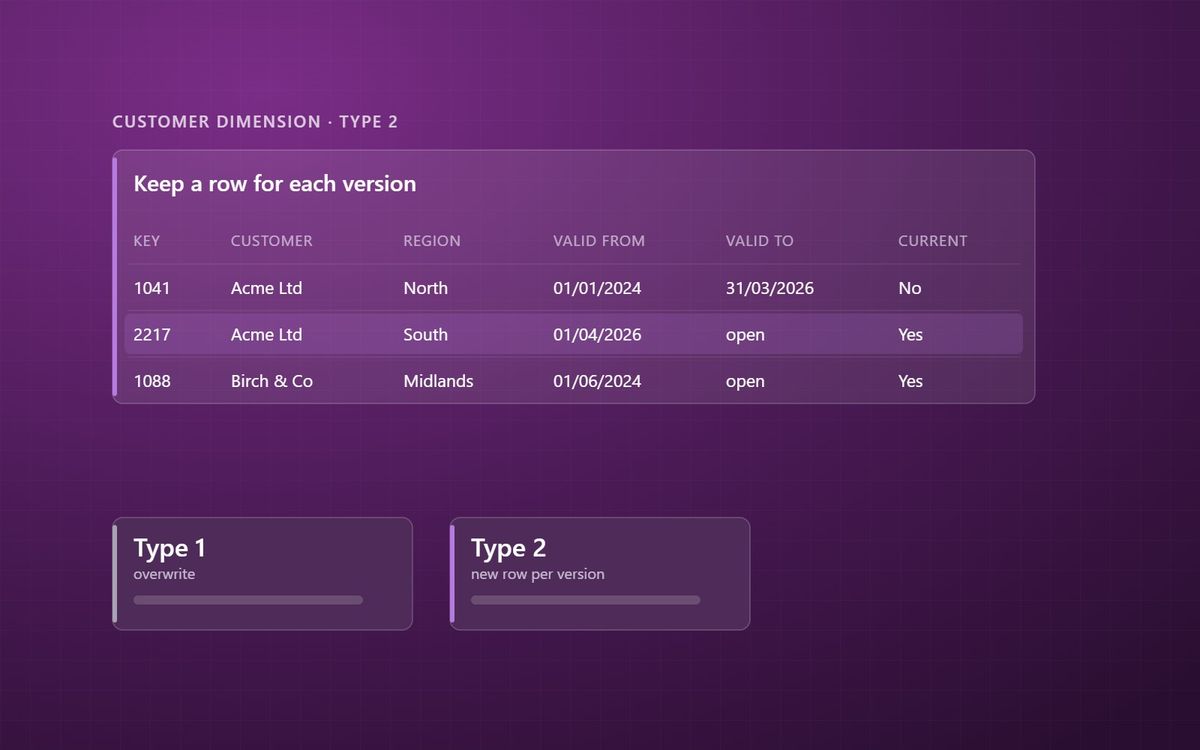
Type 2 keeps history. When the customer moves region, the old row is closed off and a new row is added. Each row carries:
- A surrogate key, a simple number generated by the model rather than the source system.
- Valid from and valid to dates.
- A current flag showing which version is live.
Each transaction links to the surrogate key of the version that was true when it happened. Last year's sales stay in North. This year's go to South. Both totals are correct for their period.
Type 2 is right whenever people need to see how things were at the time: sales by the region structure of the day, headcount by the team people were in, margin by the category a product sat in when it was sold.
Other types, briefly
You may come across other numbered types. Type 0 never changes a value once written, for things like original start date. Type 3 keeps a "previous value" column alongside the current one, useful for a single restructure. In practice most mid-market models use Type 1 and Type 2, chosen column by column.
That last point matters. The same dimension can treat different columns differently. Customer name might be Type 1, while region and account manager are Type 2.
Where it is built
Slowly changing dimensions are built in the data platform, not in Power BI. In Microsoft Fabric that usually means a notebook, pipeline or warehouse procedure in the Gold layer that compares incoming records with the existing dimension and merges the changes. The untouched copy of the source, kept in Bronze, is what lets you rebuild history if a rule changes later. We cover why in why we never let anyone touch the Bronze layer.
The business decision about which columns keep history is a governance decision, not a technical one. It belongs with the data owners, alongside the rest of your data governance definitions. Our data platform and warehouse team helps agree those rules before they are built.
Next in the series
Every one of these dimensions depends on another that never changes and appears in almost every model: the date table. It gets its own post next.
History should only change when it was wrong, never just because the present moved.
Simon Devine
Founder, Hopton Analytics
Part of the Hopton Analytics team, delivering governed analytics programmes for UK mid-market organisations.