Blog
Practical perspectives on data governance, Microsoft Fabric, Power BI and analytics strategy for UK organisations.

Slowly changing dimensions: how to keep history honest when customers, products and teams change
A sales rep moves region and suddenly last year's regional figures change. Slowly changing dimensions are how a data model decides whether history should move with them.

From prototype to production: the Azure architecture behind enterprise AI agents
Getting an AI agent to work in a demo takes an afternoon. Getting one to serve real customers, connect to enterprise data, and stay secure in production is a different challenge entirely. Here is how the Azure stack makes it possible.

Grain: the first decision in any data model, and the one most often skipped
Before you choose a single column, decide what one row means. Get the grain wrong and totals double count, budgets refuse to line up with actuals, and nobody quite trusts the numbers.

The skills that matter when the tools stop saying no
When anyone can generate a dashboard, knowing the tool stops being the edge. The skills worth building once the building is cheap.

Full load or incremental load: how to move only what changed
Reloading every table every night is simple until it is not. Incremental loads move only what changed, but they need a reliable way to know what that is, and a plan for deletes.

Star schema explained: facts, dimensions, and why Power BI wants them
One table of events in the middle, descriptive tables around the edge. The star schema is the single most useful idea in reporting data modelling, and Power BI is built around it.

What is worth adopting from a Power BI release, and what to ignore
Power BI ships features every month and most will not change your week. A four-question filter for telling the signal from the noise.

Why your source system is the wrong shape for reporting: normalised versus denormalised data
Business Central, Salesforce and every other operational system store data in a shape built for writing, not reading. Reporting needs a different shape, and that is what data modelling is for.

Three jobs, one dashboard, none of them done well
Strategic, operational, analytical: three jobs, three different dashboards. Two questions stop you building one that does none of them well.

An AI agent needs decision rights, not just intelligence.
The difficult question is not whether an AI agent can act. It is what it may decide, what evidence it must keep and when it must stop.

What the analytics consolidation wave means for your platform choices
Strong analytics platforms keep being acquired by the giants. Why that is a compliment to the category, why Pyramid is a winner in it, and how to choose well.
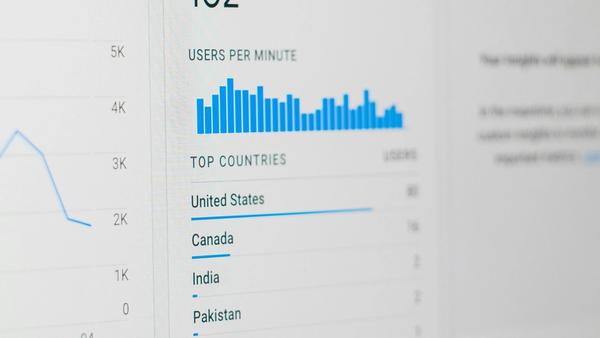
Business Central to Power BI: the complete guide to reporting beyond the built-in tools
If your finance team still exports Business Central to Excel every month, the problem is not the team - it is that Business Central's built-in reports were never designed for cross-functional management reporting. Here is every option for doing it properly with Power BI.
Stay informed
Get new insights in your inbox
We publish practical articles on analytics strategy, Power BI, and Microsoft Fabric. No spam - just useful content when we publish it.
Get started
Ready to put this into practice?
Reading about better analytics is a start. Working with us is how it happens.
Book a free audit