Microsoft gives you the Capacity Metrics app, the Monitor hub, an admin monitoring workspace and refresh history. None of them tells you what to look at. The four groups of checks that catch problems before users do, the thresholds that matter, and why the gap is judgement rather than data.
Most Fabric and Power BI estates are monitored the same way: somebody notices. A report is blank on Monday morning, a director asks why the numbers have not moved, finance spots that last week’s refresh ran against Tuesday’s data. The information needed to catch all three was in the platform the day before. Nobody was looking at it.
Microsoft provides the data. This post is about what to do with it: the four groups of checks that matter, the thresholds we use, where each one lives in Microsoft’s tooling, and the part the tooling does not do.
Where does Microsoft show you what is happening?
- The Fabric Capacity Metrics app. Compute use over 14 days, storage over 30, throttling events, and a 30-second timepoint view that splits interactive from background work. Data arrives 10 to 15 minutes after the activity. It has no alerts of its own.
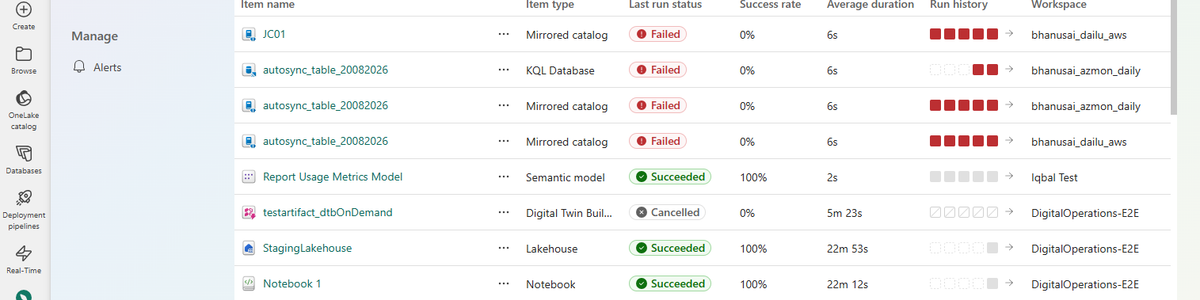
- The Monitor hub. Job runs across every item you can see, with dedicated pages for applications, capacity and cost, agents and alerts. For a failed pipeline it can now suggest likely causes.
- The admin monitoring workspace and the Govern view in the OneLake catalog. Inventory, feature usage, sharing, endorsement, sensitivity label coverage and DLP activity, refreshed once a day. Fabric administrator role required.
- Refresh history on each semantic model, with email on failure to the owner. On-demand and API-triggered refreshes do not send emails, and a schedule is paused after two months without anyone opening a report on it.
Four places, four logins, four different ideas of what matters. That is the problem.
Group one: refresh and jobs
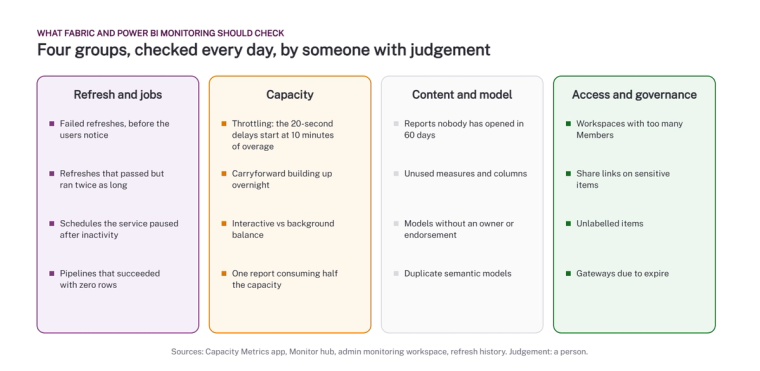
Failed refreshes are the obvious check and the least useful one, because the owner already gets an email. The checks that catch real problems are the quieter ones. A refresh that passed but took twice as long as last week is a source system or a model about to fail. A pipeline that succeeded and loaded zero rows is a broken connection reporting success. A schedule the service paused because nobody opened the report is either a report to retire or a report somebody will need at month end. Each of these shows as green in Microsoft’s tools.
Group two: capacity
Throttling in Fabric has stages. Up to 10 minutes of overage is absorbed. Between 10 and 60 minutes, every interactive request is delayed by 20 seconds. Beyond 60 minutes interactive requests are rejected, and beyond 24 hours everything is. Overage is paid off from unused capacity, or billed at three times the normal rate. The daily check is whether carryforward is building up overnight, because by the time users see the 20-second delays, the capacity has been over for a while. The other check is concentration: one badly built report or one notebook consuming half the capacity is the most common cause of a throttling event, and the Metrics app will show you which item it is if you drill into the timepoint. Our plain-English guide to Fabric capacity explains the mechanics.
Group three: content and model
This is the group nobody monitors and the one that decides whether the estate is still trustworthy in a year. Reports nobody has opened in 60 days. Semantic models with no owner and no endorsement. Two models with the same tables and different measures. Measures and columns that no visual uses but every refresh loads. None of these is an incident. All of them compound. We wrote about what unused measures and columns quietly cost; the same applies to whole reports.
Group four: access and governance
A workspace with 40 Members where 35 should be Viewers. A share link on a model that contains salary data. Items with no sensitivity label in a tenant where the policy says everything must have one. A gateway whose credentials expire on Friday. The Govern view shows the label coverage and the sharing. The gateway expiry it does not show at all, and that one takes down every report behind it at once.
What do the tools leave out?
Three things. Alerts across all four groups in one place: the Metrics app has none, the Monitor hub has them for jobs, refresh history emails only the owner. History beyond the window: 14 days of compute and a daily snapshot of governance is not enough to see a trend. And judgement: knowing that the refresh which took 40 minutes instead of 20 matters because it feeds the board pack on Thursday, and the one that failed outright does not matter because nobody has opened that report since March.
That last gap is the reason we built Orbit. It reads the same Microsoft sources listed above, nothing else, keeps the history, and puts a consultant’s judgement on what it finds. It never touches the content of your data, only the results of your estate. It is included in our annual support for end clients, whoever built the estate.
Where to start without any tooling
Pick one person. Give them 20 minutes every morning and the four lists above. Have them open the Metrics app, the Monitor hub and refresh history, write down anything in the four groups, and send one message to the team. After a fortnight you will know which checks matter in your estate and which do not, and whether 20 minutes a day is a job you want a person to do or a job you want done for you. If you would like us to run the first fortnight with you, talk to us.
Microsoft’s pages: Fabric Capacity Metrics app, Monitor hub, Admin monitoring workspace and Understand your Fabric capacity throttling.
Related reading
- Microsoft Fabric consultancy
- What Orbit watches so you do not have to
- Fabric capacity: a plain-English guide to not getting a shock on your invoice
- How do you make Azure data pipelines reliable? Observability, monitoring and the checks that matter
- What happens after go-live: hypercare, Continuity and keeping analytics governed
Vikram Muman
Analytics Optimisation Consultant
Part of the Hopton Analytics team, delivering governed analytics programmes for UK mid-market organisations.