Housebuilders and contractors run on four systems that each know part of a plot’s story. How a single model with the plot as its grain gives one version of cost to complete, build against sales, cash forecast and slippage, and what it takes to build on a Microsoft estate.
A housebuilder’s board meeting has a familiar rhythm. The commercial director brings cost to complete from the valuation spreadsheets. The sales director brings reservations and completions from the CRM. The build director brings the programme. The finance director brings what has actually been paid and invoiced. Four honest people, four spreadsheets, and an hour spent working out why the plot counts differ.
This post is about getting a housebuilder, a residential developer or a civil engineering contractor on a Microsoft estate to one set of numbers, built around the thing every one of those systems is really describing: the plot, or on a civils job, the section of works.
Why is the plot the grain?
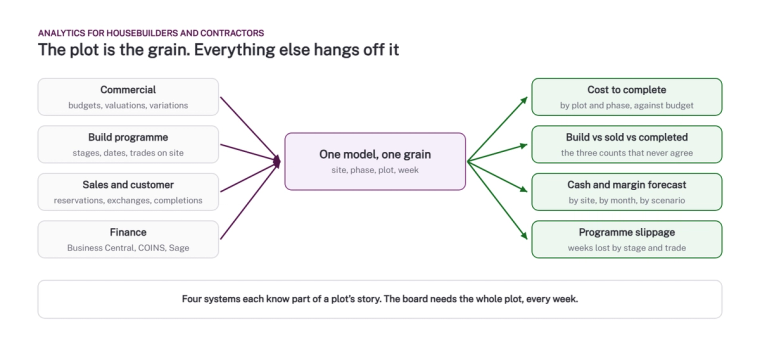
Because everything that matters to the business happens to a plot. It is budgeted, built, inspected, reserved, exchanged, completed and paid for. The commercial system knows its budget and its variations. The build programme knows which stage it has reached and which trades are on it. The sales system knows whether it is reserved. Finance knows what has been spent on it. No single system knows all four, and the board needs all four, every week.
So the model has one grain: site, phase, plot, week. Everything else is a dimension or a fact hanging off that. The same principle applies to a contractor, where the grain is contract, section, cost code, week. Our post on grain as the first decision in any data model explains why getting this wrong cannot be fixed later.
What are the numbers that matter?
- Cost to complete, by plot and phase, against budget. Committed cost plus forecast remaining, with variations shown separately so nobody can hide a problem inside a revised budget.
- Built against sold against completed. The three counts that never agree in the spreadsheets, because each system counts a plot at a different moment. The model counts each once and shows the gap, which is the stock you are financing.
- Cash and margin forecast by site and month, with scenarios. Move a completion date and watch the cash curve move. This is the number that lenders and the board actually want, and the one most firms produce quarterly in a spreadsheet when they could have it weekly.
- Programme slippage by stage and trade. Weeks lost between planned and actual stage dates, aggregated across sites. One site slipping is weather. Every site slipping at the same stage is a subcontractor or a design problem.
For contractors, replace the sales numbers with valuations and applications for payment, and add retention, so the model shows what has been earned, what has been applied for, what has been certified and what has been paid. The gaps between those four are where a contractor’s cash goes.
Where does the data come from?
Finance is usually Business Central, COINS, Sage or Eque2. Commercial and valuation data is often in the same system or in a construction-specific package, and sometimes in very large spreadsheets. Build programmes live in Asta, Microsoft Project or Excel. Sales sits in a CRM, increasingly Dynamics 365. All of these can be landed in a Fabric lakehouse on a schedule, with pipelines for the systems that have APIs and governed Excel ingestion for the ones that do not.
The hard part is not the plumbing. It is the matching. Plot 47 in the sales system must be plot 47 in the commercial system and in the finance job code, and a surprising number of businesses have never made that mapping explicit. Making it explicit is the first deliverable, and it usually finds a few plots that have been sold twice or budgeted nowhere.
What does it take to build?
For a regional housebuilder with 5 to 15 live sites, the first release is typically 10 to 14 weeks: three weeks agreeing definitions and building the plot mapping, five to seven weeks building the pipelines and the model, and the remainder reconciling against last quarter’s board pack. Cost to complete and built against sold come first. The cash forecast comes once the first two are trusted, because it depends on both.
Delivery is staged on purpose. Our post on phased delivery, not big-bang explains why a board that trusts two numbers will fund the third, and a board shown twelve numbers at once trusts none.
What about AI and Copilot?
Once the plot-level model exists, the questions that take an analyst a morning become questions anyone can ask: which sites are more than four weeks behind at first fix, which plots have cost movements over 10% this month, what happens to December cash if the Barnsley completions slip a fortnight. Copilot and Fabric data agents answer from the same definitions as the board pack, so the answer in Teams and the answer in the meeting are the same answer. That only works if the model is right, which is why it comes first.
Where to start
Pick one live site and ask the four systems how many plots are built, sold and completed. If you get four answers, you have your business case. If you want help getting to one, talk to us or start with the free data assessment and we will tell you how far your current estate is from a weekly board pack nobody argues with.
Related reading
- Microsoft Fabric consultancy
- Grain: the first decision in any data model
- Phased delivery, not big-bang: how we roll out an analytics platform in stages
- How do you combine Business Central data with CRM, payroll or project systems?
- From day seven to day two: automating the monthly reporting pack
James Morley
Analytics Solutions Consultant
Part of the Hopton Analytics team, delivering governed analytics programmes for UK mid-market organisations.