As reporting tools multiply and churn, the one layer they all sit on matters more, not less. Why the model is the bet that lasts.
Reports and data apps both query the model in DAX. The model is the one layer that stays stable while everything above it changes, which makes it the thing worth investing in first.
This connects with our data strategy and leadership work and, separately, with Qlik To Power BI: Lessons Learned The Hard Way.
There is a tempting reading of the new code-first reporting in Fabric: that the model matters less now, because the clever work has moved up into the visuals. The opposite is true. Both a Power BI report and a data app sit on top of a semantic model and query it in DAX. Whatever you build above, the model is the layer they all depend on. When the reporting tools churn, and they will, the model is the asset that carries forward.
So if you are deciding where to put your effort while the reporting layer is in flux, put it here first.
The model is the part that lasts.
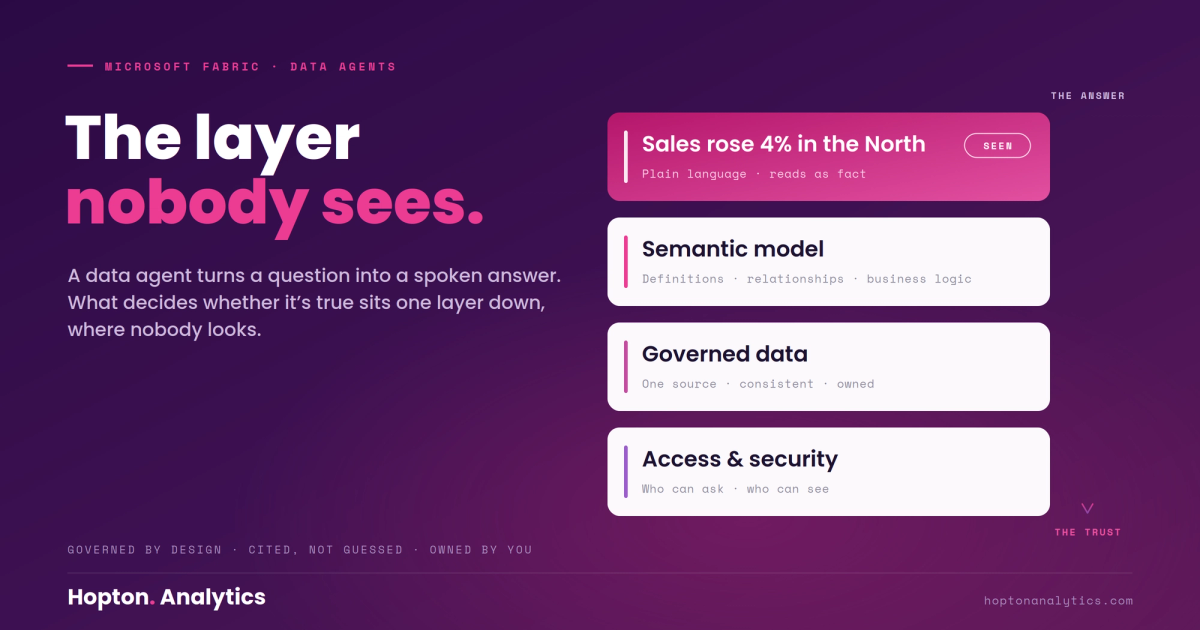
Reporting tools come and go. The canvas, the rendering engine, the latest way to draw a chart: all of it is replaceable, and increasingly it is being replaced. The semantic model is not. Your definitions, your relationships, your measures, your security: that is the accumulated logic of how your business understands itself. A report is a view of it. A data app is another view of it. Lose a report and you rebuild a view. Lose the model and you lose the meaning.
This is why a model built with care pays off across both worlds at once. You do not invest in it for Power BI or for data apps. You invest in it for whatever comes next.
The coupling that has held models back.
For years, the model and the report have been awkwardly tangled. The moment a report needed something the visuals could not give, the workaround often pushed back down into the model: a measure written not because the business needed it but because a chart did, an atypical pattern added to make a visual behave. Over time this clutters the model with report-specific logic that has nothing to do with how the business really works.
A report is a view of the model. Lose a report and you rebuild a view. Lose the model and you lose the meaning.
Code-first reporting loosens that knot. Because a data app can hold its own logic in its own layer, the report-specific contortions can live there, where they belong, instead of in the model. The model gets to be a clean description of the business again. That is a quietly significant benefit, and it is one of the stronger arguments for the new approach.
What a model worth building looks like.
A model you can trust across any reporting tool has a few things in common. The measures are defined once and mean the same thing everywhere. The relationships are deliberate rather than whatever auto-detect suggested. Row-level security is designed in, not bolted on. Performance has been considered, because every report and every data app inherits it. And the definitions are written down, so a person, or an agent, can understand what "active customer" or "net margin" means without guessing.
None of this is new advice. What is new is the stakes. When more tools depend on the same model, a weak model spreads its weakness wider, and a strong one compounds its value.
What a clean separation gives you.
When report logic can live in the reporting layer, the model stops collecting decisions that were never about the business. That sounds abstract, so here is what it looks like in practice. A model that has served reports for a few years tends to gather measures with names like "Sales for the slicer fix" or "Margin (do not use in totals)". Each was added to make a particular visual behave. None of them describes the business. They make the model harder to understand, harder to trust, and harder for anyone, person or agent, to build on correctly.
Loosen the coupling and those measures can move out, or disappear, and the model gets to be a clear, honest description of how the organisation works. That clarity is worth real money, because every report, every data app and every AI-assisted query inherits it. A confusing model spreads confusion. A clear one compounds.
The model is your protection against churn.
There is a strategic point underneath all this. The reporting layer is changing quickly and will keep changing. If your value is tied to a particular reporting tool, you are exposed to its churn. If your value sits in a strong, well-documented model, you are not, because whatever the next tool is, it will sit on top of the same model. Investing here is the most durable bet you can make while everything above it is in motion.
What we would do this quarter.
Before you chase any new reporting capability, run a health check on the model underneath it. Where do the same metrics carry different definitions? What logic is in the model only because an old report needed it? Where is performance quietly costing every report that touches it? Fix those, and everything you build on top, in any tool, gets better at once. Skip it, and you are decorating a foundation you have not checked.
If any of this sounds familiar, talk to us about your data.
Related reading
- What Fabric data apps change, and what they don't
- Power BI report or data app: choosing well
- The Power BI Semantic Model Is The Real Asset
- ODBC to ADBC in Power BI: what’s actually changing
Shauna Duffy
Director of Professional Services
Part of the Hopton Analytics team, delivering governed analytics programmes for UK mid-market organisations.