Stop refreshing by hand. The pattern for automating ETL behind Power BI: pipelines, dataflows, a clean gold layer, triggered refresh and checks that alert.
You automate ETL for Power BI reporting by taking the extraction and transformation out of the report and putting it in a scheduled, monitored pipeline that lands clean tables in a data store, then refreshes the Power BI semantic model when the tables are ready and alerts someone when they are not. That one sentence is the whole pattern. Most Power BI estates that feel manual have the pattern inverted: Power Query inside the report does the extraction, the transformation and the business logic, someone presses refresh, and when a source changes the report breaks and the finance team goes back to exporting from the ERP into Excel. This post sets out how to move from that to something that runs itself, in Fabric or in Azure, and what each step looks like.
Step one: move the transformation out of the report
Power Query in Power BI Desktop is a fine tool for shaping a table, and a poor place to run an ETL process, because it runs on every refresh, is invisible to anyone but the report author, cannot be tested, and is duplicated in every report that needs the same table. The first move is to take that logic and put it somewhere shared: a Dataflow Gen2 if it is Power Query already and the volumes are modest, a Fabric notebook if it needs joins, history or scale, or a Fabric pipeline with a copy activity if it is pure extraction. The rule is that a report should connect to tables that are already correct. ETL, ELT or EtLT covers where each kind of rule belongs.
Step two: land data in layers
Automated ETL lands data in a store with three layers. Raw extracts go into bronze unchanged, so a bad transformation can be rerun without going back to the source. Cleaned, typed and deduplicated data goes into silver. The star schema the report needs, facts and dimensions with measures defined once, goes into gold. In Fabric those layers are Delta tables in a lakehouse on OneLake; in a classic Azure estate they are Azure Data Lake Storage folders or a SQL database. The layers are what make the process automatable, because each step has a defined input and output that can be checked. The layered lakehouse explained walks through them in detail.
Step three: orchestrate with a pipeline, not a schedule
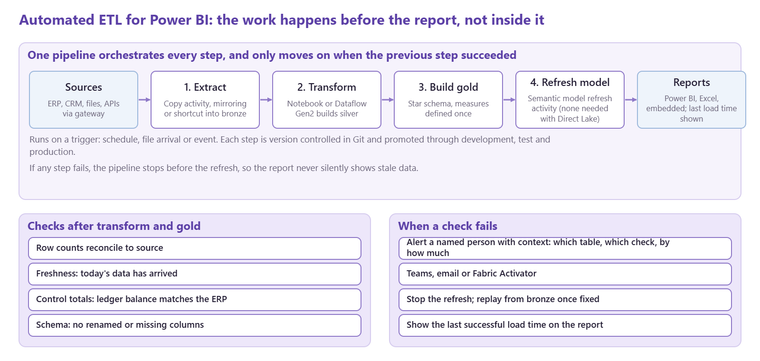
A Fabric pipeline, or Azure Data Factory in an older estate, runs the steps in order: extract, then transform to silver, then build gold, then refresh the semantic model, and only moves to the next step when the previous one succeeded. That is the difference between orchestration and scheduling. A scheduled refresh at 6am runs whether or not the extract at 5am worked; a pipeline that refreshes the model only after the gold tables are rebuilt cannot show stale data without saying so. Fabric pipelines have a semantic model refresh activity for exactly this, which removes the Power BI REST API call that older estates wrote by hand. Orchestration is not scheduling explains how to structure the dependencies.
Step four: choose the refresh pattern
There are three ways the Power BI model gets its data, and automation looks different for each. Import mode copies data into the model on refresh, so the pipeline triggers a refresh at the end; this suits most finance and sales reporting with a nightly or hourly cadence. Direct Lake, available when the gold tables are Delta tables in OneLake, reads the tables directly, so there is no refresh to trigger at all; the report shows the new data as soon as the pipeline writes it. DirectQuery runs queries against the source at view time and is the right answer only for genuinely live operational data, because it moves the performance problem to the person opening the report. For most businesses the automation target is import now and Direct Lake once the data is in Fabric.
Step five: add the checks that make it trustworthy
A pipeline that runs is not the same as data that is right. Automated ETL needs row counts reconciled to source, a freshness check that confirms today's data arrived, a reconciliation of a control total such as the general ledger balance, and an alert to a named person when any of those fail, through Teams, email or Fabric Activator. The alert is the part people skip, and it is the part that stops the finance team finding the problem first. Testing a data pipeline lists the checks, and showing the last successful load time on the report itself is the cheapest trust signal there is.
Step six: version control and deploy
The transformation code, whether notebooks, dataflows or pipeline definitions, lives in Git through Fabric's Git integration, and moves from a development workspace to test to production through deployment pipelines. This is what lets a second person change the ETL safely, and what lets you roll back when a change breaks a number. It also ends the situation where the only copy of the logic is inside one person's Power BI Desktop file.
What changes for the people using the reports
The visible change is that nobody refreshes anything, the data is there when they arrive, and when it is not there the message says why. The less visible change is that one definition of margin, ageing or utilisation feeds every report, because it is calculated in gold rather than in each report's Power Query. That is usually the point at which the Excel export stops, and it is the test we apply to whether the automation has worked. If your estate is still at the refresh-by-hand stage, our Power BI report automation page describes what the move involves and our free audit is the quickest way to see how far you are from it.
Related reading
Orchestration is not scheduling: how pipelines survive at scale
ETL, ELT or EtLT: when to transform data in Fabric, and where the rule should live
Testing a data pipeline: the checks that catch wrong numbers before the board does
Notebooks, Dataflows Gen2 or pipelines: choosing the right Fabric tool for each job
Isobel Bowers
Analytics Consultant
Part of the Hopton Analytics team, delivering governed analytics programmes for UK mid-market organisations.