A theme file sets the colours, fonts and visual defaults for a whole report in one go. Here is how it is structured, how to apply it, and how to build one that saves formatting work.
A Power BI theme is a JSON file that sets a report's data colours, background and text colours, text styles and default formatting for visuals, and you apply it in Power BI Desktop from the View ribbon, under Themes, then Browse for themes. A good theme means every new visual arrives formatted correctly, so report authors spend their time on the data rather than on the formatting pane.
How to apply a theme
- 1Open the report in Power BI Desktop.
- 2On the View ribbon, open the Themes gallery.
- 3Choose Browse for themes and select the JSON file.
The theme applies to every page at once. Formatting you have set by hand on an individual visual still overrides the theme, which is why it pays to apply the theme first and format by exception afterwards. You can also start from a built-in theme, adjust it with Customize current theme, and export the result with Save current theme. Our Power BI themes gallery has ready-made files to start from.
What each section does
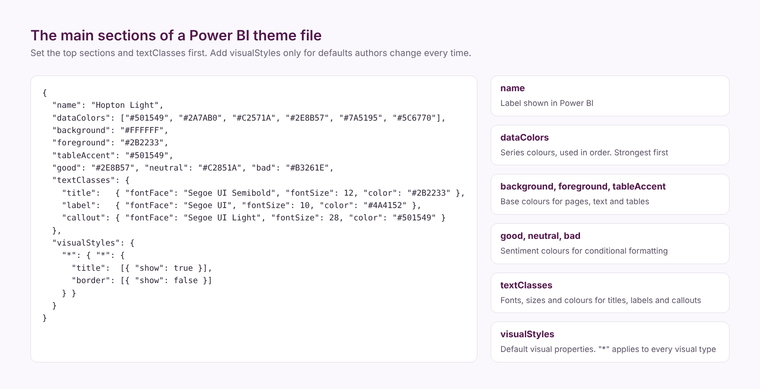
name is the label shown in Power BI.
dataColors is the list of colours used, in order, for series in charts. The first three or four do most of the work, so put your strongest, most distinct brand colours first.
background, foreground and tableAccent set the report's base colours: page and visual backgrounds, main text, and the accent used in tables and matrices.
good, neutral and bad, and maximum, center and minimum, set the colours used for sentiment and for the default diverging colour scales in conditional formatting.
textClasses sets the font, size and colour for the main text styles: titles, headers, labels and callouts such as card values. Setting these once is what makes every visual consistent.
visualStyles sets defaults for visual properties: titles on or off, borders, padding, shadows, axis settings. The asterisk wildcard applies a setting to every visual type, and named visual types can override it. This is the most powerful section and the easiest to overdo.
What to set first
Set name, dataColors, background, foreground and tableAccent, then textClasses. That alone gives a consistent report. Add visualStyles only for the defaults your authors change on almost every visual, such as switching on visual titles, setting a consistent border and padding, or turning off a default shadow.
Mistakes to avoid
- Too many data colours. Ten strong colours in a row make every chart look busy. Six to eight distinct colours is plenty.
- Low contrast. Pale colours on a white background fail accessibility checks and are hard to read on a projector. Our post on accessible colour palettes covers how to test this.
- Fixing everything in visualStyles. Every property set in the theme is one more thing authors have to override when they need something different. Set defaults, not rules.
- Editing by hand without a schema. Microsoft publishes the theme JSON schema on GitHub. Editing against it in a code editor catches typos that Power BI would otherwise ignore silently.
- Not versioning the file. Keep the theme in source control or a shared library, so every report uses the same version and a brand change happens in one place.
A theme makes reports look consistent. It does not make them useful; that comes from the model and the design of each page. If you want both, our Power BI team designs and builds reports that people use.
Related reading
Self-service BI that people use
Fewer dashboards, more decisions
Why your Power BI reports are slow
Power BI and Power Apps: how they actually work together
Maisie Hudson
Analytics Consultant
Part of the Hopton Analytics team, delivering governed analytics programmes for UK mid-market organisations.