A report that relies on red and green alone, or pale colours on white, shuts out part of its audience. Here are the contrast rules, the built-in accessible themes, and the checks to run before you publish.
An accessible colour palette in Power BI is one where every chart element has a contrast ratio of at least 3:1 against what sits next to it, text has at least 4.5:1 against its background, and no meaning depends on colour alone. Power BI Desktop includes five built-in Accessible themes designed to that standard, and a short set of checks before publishing catches most of the rest.
Why it matters
Microsoft cites estimates that about 1 in 12 men (8%) and 1 in 200 women (0.5%) have some form of colour vision deficiency. In a business of a few hundred people, several of your report users are likely to be among them, and most will never mention it. Low contrast also hurts everyone else: on a projector, on a laptop in sunlight, or at the end of a long day.
The contrast rules
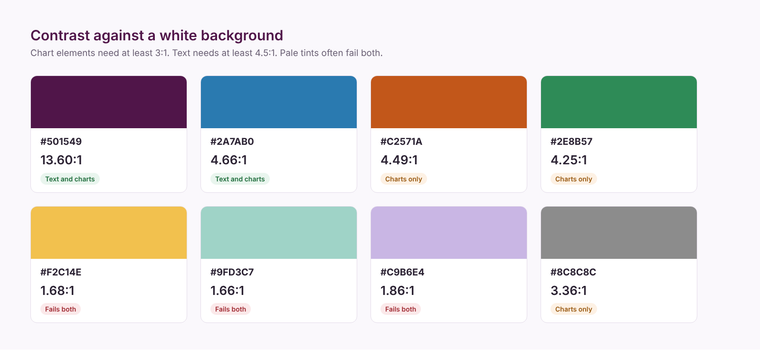
The Web Content Accessibility Guidelines (WCAG) set the thresholds most organisations use:
- Text: a contrast ratio of at least 4.5:1 against its background, or 3:1 for large text.
- Chart elements and other graphics: at least 3:1 against adjacent colours, for any part of the graphic needed to understand it.
- Colour is not the only signal: information shown by colour must also be available another way, such as a label, a shape or a pattern.
The built-in Accessible themes
Power BI Desktop includes five themes designed for accessibility: Accessible Default, Accessible City park, Accessible Tidal, Accessible Neutral and Accessible Orchid. You find them on the View ribbon, in the Themes gallery. Microsoft's own guidance is that bar, column, pie, donut and gauge charts meet the 3:1 standard with these themes, but line charts may not, because lines can end up next to other lines without enough contrast. The report author is still responsible for checking.
If you use your own brand theme, test its data colours the same way. Brand palettes often include pale tints that fail against white. Our post on building a Power BI theme file explains where those colours live in the JSON.
Designing for colour blindness
- Avoid red against green as the only signal. It is the most common confusion. Use red against blue, or add an icon or label.
- Label directly. Data labels and direct labels on lines remove the need to match colours to a legend.
- Use markers and line styles. Different marker shapes or dashed lines separate series without relying on hue.
- Limit the palette. Fewer colours, with more difference in lightness between them, are easier for everyone to tell apart.
- Give conditional formatting a second cue. Pair red, amber and green with icons or text.
Checks before you publish
- 1Check text and chart colours with a contrast checker against the actual background.
- 2View the report in greyscale. If two series become the same grey, they rely on hue alone.
- 3Add alt text to each visual and set a sensible tab order in the Selection pane for keyboard and screen reader users.
- 4Confirm the report reads in Windows high contrast mode.
Accessibility is cheapest when it is built into the theme and the design standards at the start. Our Power BI team builds reports to these standards, and our themes gallery is a starting point for palettes.
Related reading
How do you build and apply a Power BI theme file?
Power BI report or data app: choosing well
Self-service BI that people use
Maisie Hudson
Analytics Consultant
Part of the Hopton Analytics team, delivering governed analytics programmes for UK mid-market organisations.