
Adoption, answer quality, data health and cost, three measures each, and the Microsoft tool where each one lives. A scorecard to run monthly.
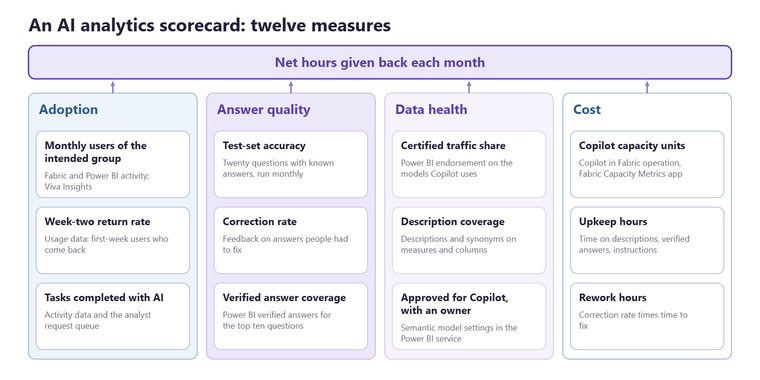
An AI analytics scorecard on Microsoft Fabric and Copilot should track twelve measures in four groups, each with a known source. Adoption: the share of intended users who used Copilot or a data agent in the month, the share who came back after their first week, and the number of tasks completed with AI. Answer quality: the share of a fixed test set of questions answered correctly first time, the share of real answers that needed correcting, and how many of the most-asked questions have a verified answer. Data health: the share of AI traffic answered from certified semantic models, the share of measures and columns with descriptions, and whether each model used by Copilot is approved for Copilot and owned by a named person. Cost: Copilot in Fabric capacity units from the Fabric Capacity Metrics app, the time spent on upkeep, and the time spent on rework. Together they feed the one number the board wants, net hours given back each month, and they tell you which lever to pull when it stalls. This post sets out each measure, where to find it in Microsoft's tools, and how to run the scorecard monthly.
Adoption: is it being used, and does it stick?
Monthly users as a share of the people it was built for, not of all staff. Week-two return rate: the share of first-week users who used it again the following week, which separates curiosity from habit. And tasks completed with AI, the count that feeds the net hours calculation. Usage of Copilot across Microsoft 365 appears in the Copilot Dashboard in Viva Insights; usage of Copilot and data agents over your own models is best counted from Fabric and Power BI activity, alongside a simple count of the requests that no longer reach the analyst queue.
Answer quality: is it right?
Accuracy on a fixed test set: twenty or so business questions with answers reconciled to the ledger, run monthly and after every model change. Correction rate on real use: the share of answers a person had to fix, captured with a simple thumbs down or a short form. Verified answer coverage: of the ten questions asked most, how many have a verified answer in Power BI, which ties a trigger phrase to a trusted visual. Quality is the measure that most often moves net hours, because every wrong answer costs more than a right one saves. Fabric IQ and Copilot on your semantic model covers the preparation.
Data health: is the foundation fit for AI?
Certified traffic share: the share of Copilot and agent questions answered from semantic models endorsed as certified rather than from personal or uncertified ones. Description coverage: the share of measures, columns and tables with descriptions and synonyms in the business's own words, which Copilot reads to choose the right field. Readiness: whether each model Copilot uses is marked Approved for Copilot in the Power BI service, has its AI data schema and instructions set, and has a named owner who reviews it. Can a Power BI consultancy build certified, governed datasets? explains certification.
Cost: what does it take to run?
Capacity: the Copilot in Fabric operation in the Fabric Capacity Metrics app, converted to pounds at your capacity rate; Copilot operations run as background jobs smoothed over 24 hours, so they rarely cause throttling on their own. Upkeep: hours spent each month on descriptions, verified answers, instructions and the test set. Rework: hours spent correcting wrong answers, from the correction rate. In most mid-market estates the second and third lines are larger than the first. How much does Microsoft Fabric cost? has the capacity prices.
Running it monthly
One page, twelve numbers, a trend for each, and the net hours figure at the top. Review it with the model owners and one business sponsor, pick the one lever that would move net hours most, and act on it before the next review. Most first scorecards show strong adoption, middling quality and thin data health, and the fix is in the model, not the prompts. How do you measure whether AI analytics is paying off? sets out the net hours calculation, and our AI and analytics page describes how we build the scorecard into a programme.
Related reading
How do you measure whether AI analytics is paying off?
How does Microsoft Fabric support AI and machine learning workloads?
Is Power BI Copilot worth turning on, and what does it need first?
What is a semantic model, and why does it matter in a data platform?
James Morley
Analytics Solutions Consultant
Part of the Hopton Analytics team, delivering governed analytics programmes for UK mid-market organisations.