
One number for the board: hours AI gives back each month, net of checking, rework and cost. How to calculate it for Copilot and data agents on Fabric.
You measure whether AI analytics is paying off with one number: the hours it gives back to the business each month, net of what it costs. Work out how many tasks people now complete with AI, such as a question answered by Copilot over a Power BI model or a Fabric data agent, multiply by the time saved on each against the old way of doing it, then subtract the time spent checking and correcting answers, the time spent keeping the model and the agent in good order, and the running cost converted into hours. Logins, prompts and active users tell you whether people are trying it; net hours tells you whether it is worth having. When we work the numbers through for a mid-market finance or operations team, the compute is rarely the large cost: at UK South pay-as-you-go rates a typical Copilot question in Fabric costs about 2p of capacity. The large costs are rework when an answer is wrong and the upkeep of the definitions underneath, which is why the measure has to include them. This post sets out the calculation, a worked example, and what to measure first.
The calculation
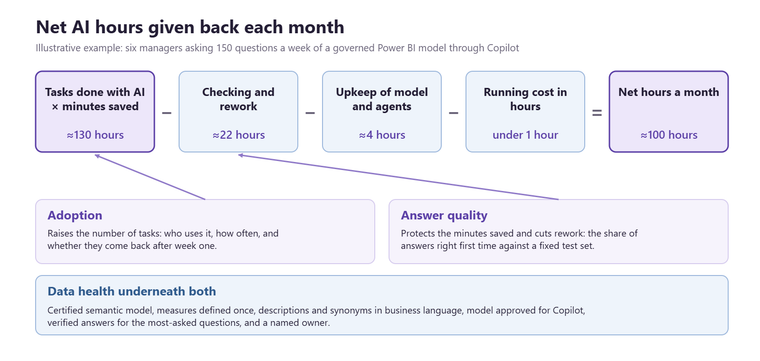
Net AI hours per month equals tasks completed with AI, times minutes saved per task, minus checking and rework, minus upkeep, minus running cost in hours. Each term is measurable. Tasks completed with AI come from usage data: Copilot activity in Power BI and Fabric, questions to a data agent, or a simple count of the requests that no longer reach the analyst queue. Minutes saved per task need a baseline: how long the same task took before, timed on a sample of real requests rather than estimated. Checking and rework is the time people spend confirming an answer and fixing the ones that were wrong. Upkeep is the time spent keeping definitions, descriptions, verified answers and agent instructions current. Running cost is the capacity, credits and licences, divided by a loaded hourly rate so it sits in the same unit as everything else.
A worked example
Take an illustrative finance and operations team of six managers who each ask around 25 questions a week of a governed Power BI model through Copilot. Before, each question took about 15 minutes of digging or an analyst request; now it takes about 3 minutes including a quick check. That is 12 minutes saved on 150 questions a week, around 130 hours a month. Suppose one answer in ten is wrong or incomplete and takes 20 minutes to resolve: that is about 22 hours a month of rework. Keeping the model's descriptions, synonyms and verified answers current takes perhaps four hours a month. The compute, at roughly 400 capacity unit seconds for a question of 2,000 input and 500 output tokens, is about £11 a month at UK South pay-as-you-go, well under an hour at any loaded rate, and usually absorbed by capacity headroom you already pay for. Net: around 100 hours a month. The sensitivity is in the rework line, not the compute line. If the error rate doubles, the net falls by a fifth.
Why logins and prompts mislead
Active users and prompt counts rise in the first month of any rollout and say nothing about value. A team can be enthusiastic users of an assistant that gives confident wrong answers, and the cost of those answers lands elsewhere, in a corrected forecast or a decision made on the wrong margin. Usage belongs in the measure as the count of tasks, not as the outcome. The agent is not the hard part makes the same point about agents.
The three levers underneath
Adoption raises the number of tasks: who uses it, how often, and whether they come back after the first week. Answer quality protects the minutes saved: the share of answers that are right first time, tested against a fixed set of questions with known answers. Data health underpins both: a semantic model with measures defined once, descriptions and synonyms in the business's own words, the model approved for Copilot in the Power BI service, and verified answers for the questions asked most. Most of the improvement in net hours comes from the third lever, because it moves the other two. How do you build a governed data foundation before AI? covers it.
An alternative measure: work finished
Some organisations prefer to count finished work rather than hours: reports retired, requests closed without an analyst, month-end packs produced without manual steps. It avoids arguments about baselines and is easier to explain to a board. It works well alongside net hours, and on its own for teams where timing tasks would cause more friction than it is worth. How do you measure the return on analytics? sets out the wider approach.
What to measure first
Pick three recurring questions or tasks, time them before you switch anything on, and count them afterwards. Build a set of twenty questions with known answers and run it monthly. Read the Copilot in Fabric operation in the Fabric Capacity Metrics app once a month. That is enough to calculate net hours for the first quarter, and to know which lever to pull next. Our AI and analytics page describes how we set this up, the AI data readiness checker gives a first read on the data lever, and what an AI analytics project costs puts figures on the build.
Related reading
Agentic AI ROI: decide what you are measuring before you build an agent
Is Power BI Copilot worth turning on, and what does it need first?
How do you measure the return on analytics?
The agent is not the hard part: your people decide whether it pays back
Simon Devine
Managing Director
Part of the Hopton Analytics team, delivering governed analytics programmes for UK mid-market organisations.