The Hopton Data Score puts a mid-market data estate on a five-level scale, from spreadsheet-run to decision-ready. What the data assessment looks at, how the score is worked out, and what the report gives you.
Most businesses know roughly where they stand with their data. Finance has a view, IT has another, and the board has a third. The Hopton Data Score exists to replace those three views with one number that everyone can argue with, and then act on.
It is the output of our free data assessment. This post explains what the score is, what we look at to work it out, and what you get at the end.
What is the Hopton Data Score?
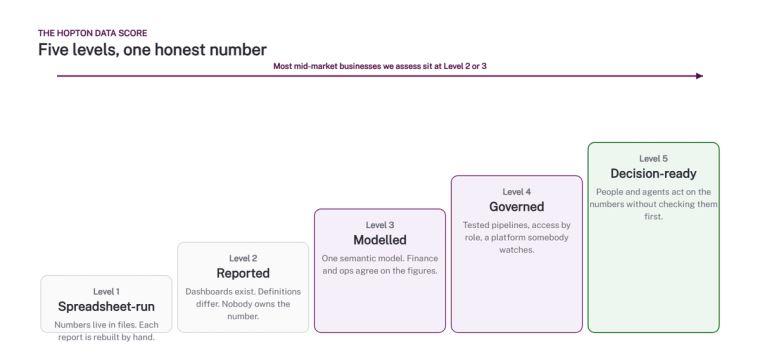
The Hopton Data Score is a five-level rating of how well a business turns its data into decisions. It is not a technology score. A business with Microsoft Fabric and twelve dashboards can sit at Level 2. A business on Business Central with one well-built semantic model can sit at Level 3. The score measures what happens to the numbers, not what software the numbers pass through.
- Level 1, spreadsheet-run. The numbers live in files. Each report is rebuilt by hand, usually by one person, usually at month end.
- Level 2, reported. Dashboards exist, often several versions of the same one. Definitions differ between them and nobody owns the number.
- Level 3, modelled. There is one semantic model that finance and operations both use. The figures agree, and someone is responsible for them.
- Level 4, governed. Pipelines are tested, access is set by role, changes go through a release process, and somebody watches the platform every day.
- Level 5, decision-ready. People, and increasingly agents, act on the numbers without checking them first, because the proof is built in.
What does the data assessment check?
We look at five things, and we weight them equally. Each is scored from 1 to 5 and the Data Score is the pattern across them, not the average, because a Level 5 platform with Level 1 adoption is a Level 2 business.
- Sources. Where the data comes from, how it gets out, and how often it breaks. Business Central, Dynamics 365, Sage, NetSuite, a payroll system, a spreadsheet of targets.
- Model. Whether there is a single trusted layer, who owns the definitions, and whether two reports can disagree.
- Platform. What the data sits on, how it is refreshed, what it costs, and who is told when a refresh fails.
- Governance. Access, sensitivity, release process, and whether anyone would notice a wrong number before the board did.
- Use. Who opens the reports, how often, and what decision changed because of them last month.
If you already run Fabric or Power BI, we can read a good deal of this from the estate itself rather than from a questionnaire. That is the same approach our Orbit monitoring takes: look at the results of the platform, never at the content of the data.
How is the assessment run?
It takes about two weeks of elapsed time and roughly three hours of yours. A short online questionnaire first, ideally completed by two or three people independently, because the gaps between their answers tell us as much as the answers do. Then a one-hour call with the people who own the numbers, and a read of the estate where you give us access. We write the report and walk you through it.
There is no charge and no obligation. We do it because the businesses that score themselves honestly are the ones that go on to do something about it, and some of them do it with us.
What do you get back?
- Your Data Score, with the score for each of the five areas and the evidence behind each one.
- The three things that would move you up a level, in order, with a plain estimate of effort for each.
- A value case written to our published rules: the hours a change saves, the decision it improves, and what we would expect it to be worth in the first year. We publish the rules so you can check the arithmetic.
- A roadmap that fits the level you are at. A Level 2 business does not need a lakehouse. It needs one model that two departments agree on.
What happens next, if anything?
For many businesses the right next step is small: a priced piece of Business Central reporting work, or a fix to the model that already exists. For some it is a Fabric foundation, and for a few it is an ongoing data function through our Analytics Acceleration Programme. The report says which, and why, and you can take it to anyone.
If you want to know your number, start the assessment. If you want to talk it through first, get in touch.
Related reading
- Free data assessment
- What are the signs a business has outgrown spreadsheets and needs a data platform?
- How do you build a single trusted analytics layer for a business?
- Start with the data you have: a practical way to take stock before you build
- What should be included in an analytics acceleration programme?
Simon Devine
Managing Director
Part of the Hopton Analytics team, delivering governed analytics programmes for UK mid-market organisations.