
Recruitment runs on three systems that count placements differently. How a single model over Bullhorn, pay and bill and finance gives one version of net fee income, time to fill and contractor margin, what it takes to build, and what Bullhorn’s API does and does not give you.
Every recruitment business we have worked with has the same Monday morning argument. The CRM says 41 placements last month. Pay and bill says 38 started. Finance has invoiced 35. All three are right, and the board pack has to pick one.
This post is about how a recruitment business on a Microsoft estate gets to one set of numbers: net fee income, time to fill and contractor margin, reported the same way to a consultant on a Friday and to the board at quarter end. It covers what the model looks like, where the data comes from, and what the work involves.
Why are recruitment numbers so hard to agree?
Because the three systems that hold them were built for three different jobs. The CRM, usually Bullhorn or Vincere, records a placement when a consultant books it. Pay and bill records it when a timesheet arrives. Finance records it when the invoice is raised. Add contractors who extend, perm fees with rebate periods, and consultants who move desks, and three honest systems produce three honest answers.
The fix is not a better dashboard on any one of them. It is a model that sits across all three, matches a placement in one system to its timesheets in another and its invoices in the third, and defines each number once.
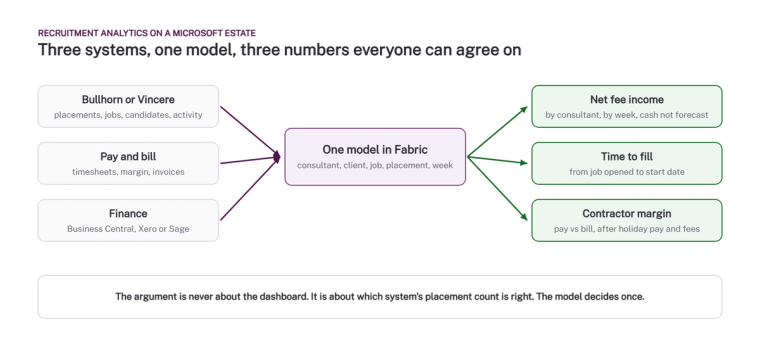
What are the three numbers?
- Net fee income, by consultant and by week. Perm fees net of rebates actually incurred, plus contractor margin for hours actually worked. Not forecast, not booked, not "expected to start". Consultants can see where they stand on a Friday without waiting for finance.
- Time to fill. From the day a job is opened to the day the candidate starts, split by sector and by client. This is the number that tells you which clients are worth the effort and which consultants need help with their pipeline rather than their closing.
- Contractor margin. Bill rate less pay rate, less holiday pay, umbrella fees and statutory costs, by contractor and by week. Most firms know their headline margin. Far fewer know it after costs, per contractor, and that is where the leak usually is.
There is a fourth number worth adding once the three are stable: consultant activity against outcome. Calls, CVs sent, interviews, offers, placements. Not to police people, but because the ratio between stages tells a manager where to coach.
Where does the data come from?
Bullhorn exposes its data through a REST API rather than a Power BI connector, so the usual pattern is a Fabric Data Factory pipeline or a notebook that pulls jobs, candidates, placements, notes and activity into a lakehouse on a schedule. Pay and bill systems vary, but most export cleanly or have an API. Finance is usually Business Central, Xero or Sage, and those routes are well trodden.
The model underneath is a star schema with one grain: a placement week. Dimensions for consultant, client, job, candidate, contractor and date. Facts for placements, timesheets and invoices, each carrying the keys that let the model match a placement across systems. Our post on grain, the first decision in any data model explains why that choice comes first.
What does it take to build?
For a firm of 30 to 150 consultants on Bullhorn with a separate pay and bill system and Business Central or Xero, the first release is typically 8 to 12 weeks: two weeks agreeing definitions with finance and the sales director, four to six weeks building the pipelines and the model, and the rest reconciling against last quarter’s board pack until the numbers match or the difference is explained.
The agreement stage is the one firms want to skip and the one that decides everything. When does a placement count? When is a rebate recognised? Which consultant gets the credit on a split desk? Write those down once and the model enforces them forever.
What about AI?
Once the model exists, the questions a managing director asks on a Monday can be asked in plain English through Copilot or a Fabric data agent, and the answer comes from the same definitions as the board pack. Several recruitment firms are going further and using their Bullhorn data as the grounding for their own AI tools, matching and sourcing included. That only works when the data underneath is clean and the definitions are agreed, which is the same work described above. Our post on what a semantic layer is and why AI needs one covers the principle.
Where to start
Take last month’s board pack, pick the net fee income figure, and ask the three systems what they say. The gap between the answers is your business case. If you want help closing it, talk to us, or start with the free data assessment and we will tell you how far your current estate is from one set of numbers.
Related reading
- Power BI consultancy
- Grain: the first decision in any data model
- Why Power BI reports show different numbers, and how to fix it
- How do you combine Business Central data with CRM, payroll or project systems?
- What a semantic layer is, and why AI needs one
Maisie Hudson
Analytics Consultant
Part of the Hopton Analytics team, delivering governed analytics programmes for UK mid-market organisations.