SQL Server 2025 folds Reporting Services into Power BI Report Server, which makes this the year to decide. What an .rdl report, a subscription, a tabular model and a multidimensional cube each become in Power BI, the tools Microsoft provides, what does not convert, and the order to do it in.
A lot of UK mid-market businesses still run their most important reports on SQL Server Reporting Services, often with an Analysis Services cube underneath. They work. Finance trusts them. And for years there was no pressing reason to move them.
There is one now. From SQL Server 2025, Microsoft has consolidated on-premises Reporting Services under Power BI Report Server. SSRS as a separate product stops with SQL Server 2022. Nothing breaks tomorrow, but the direction is set, and the question becomes how to move without losing the reports finance relies on. This post sets out what each piece becomes and the order to do it in.
What does each piece become in Power BI?
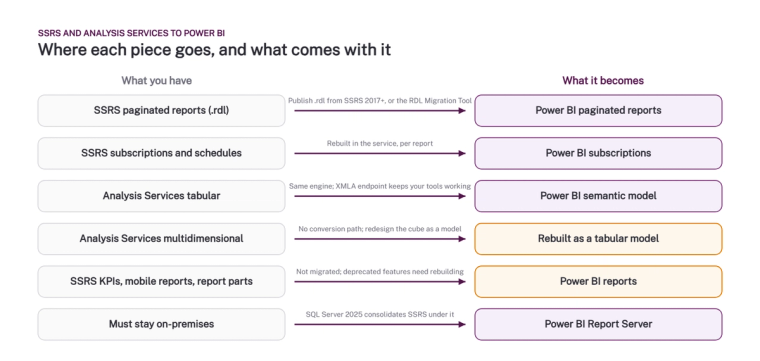
- SSRS paginated reports become Power BI paginated reports. An .rdl file is an .rdl file. For SSRS 2017 and later, and for Power BI Report Server, there is a built-in Publish to Power BI option. For older versions, Microsoft’s RDL Migration Tool checks each report for unsupported data sources and features, converts shared data sources and datasets to embedded ones, and publishes the reports that pass. It does not touch the originals.
- Subscriptions and schedules become Power BI subscriptions, rebuilt per report in the service. There is no bulk conversion, so this is a list to work through.
- Analysis Services tabular models become Power BI semantic models. It is the same engine. The model can be deployed to a Fabric workspace through the XMLA endpoint, and the tools your team already uses, Tabular Editor, DAX Studio, SSMS, keep working.
- Analysis Services multidimensional cubes have no conversion path. They are redesigned as tabular models. This is the part people underestimate, and also the part that usually improves the reporting, because a cube built in 2014 encodes a lot of decisions nobody remembers making.
- KPIs, mobile reports, report parts and report models are not migrated. Microsoft lists them as deprecated. They are rebuilt as Power BI reports, and most of them are better for it.
- If some reports must stay on-premises, for regulatory or network reasons, Power BI Report Server is the on-premises destination, and it is where SSRS now lives from SQL Server 2025.
What does not convert?
Beyond the deprecated features above, Microsoft’s list is short but specific: custom code DLL references are not supported, resources such as image files do not come across automatically, and any data source that paginated reports in the service cannot reach will need a gateway or a different route. Linked reports migrate as ordinary reports, so if you had one report linked twenty times with different parameters, you now have twenty reports or one report with parameters.
Paginated reports in the Power BI service also need a Pro or Premium Per User licence to publish, and a capacity to run on. The capacity question is worth settling early, because a paginated report that ran for free on a server now consumes capacity units.
What order should you do it in?
Model first, reports second, server last. Move or rebuild the Analysis Services model as a Power BI semantic model and get finance to sign off that it matches. Then migrate the paginated reports to point at the new model, so you are not maintaining two models while you move. Then rebuild the subscriptions. Only then turn the SSRS server off.
Doing it the other way round, reports first, leaves you with Power BI reports pointing at an on-premises cube through a gateway, which works but is slow and keeps the old server alive indefinitely. Our post on whether to rebuild or lift and shift your reports when migrating BI platforms covers the rule we use for deciding which reports to migrate as they are and which to rebuild.
How long does it take?
For a typical estate, one tabular model or one cube, 40 to 80 paginated reports and a few dozen subscriptions, allow 10 to 16 weeks. The model is three to six of those, depending on whether it is tabular already or a cube being redesigned. The reports run in parallel once the model exists, at a rate that depends almost entirely on how many of them anyone still opens. Every estate we have looked at had between 30% and 50% of its reports unused, and finding that out is the first week’s work.
Should you go straight to Fabric?
If you are moving anyway, land the semantic model in a Fabric workspace rather than a Power BI Premium one. The engine is the same, the capacity is cheaper to right-size, and it leaves the door open to Direct Lake, Copilot and data agents later without another move. Our post on the Power BI Premium to Fabric capacity move explains the licensing side.
If you want to know what is in your SSRS estate before you decide, the free data assessment includes an inventory of reports, models and usage. Or talk to us about the move itself.
Microsoft’s pages: Migrate SQL Server Reporting Services reports to Power BI and Reporting Services and Power BI Report Server.
Related reading
- Power BI consultancy
- Should you rebuild or lift and shift your reports when migrating BI platforms?
- How long does a BI migration take, and how do you keep reporting running meanwhile?
- What are the risks of migrating from one BI tool to another?
- The Power BI semantic model is the real asset
Maisie Hudson
Analytics Consultant
Part of the Hopton Analytics team, delivering governed analytics programmes for UK mid-market organisations.