Every portfolio company sends a pack, in its own format, from its own system. Here is how a fund gets one view it can compare, without asking anyone to change their ledger.
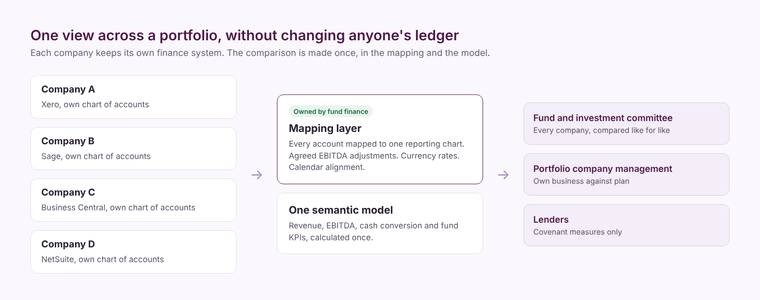
A private equity firm gets one view of performance across portfolio companies by leaving each company on its own finance system, mapping every company's chart of accounts to a single reporting chart, landing the data in one platform, and calculating revenue, EBITDA, cash and the fund's chosen KPIs once, in one model. Nobody re-keys a pack. Nobody changes ledger.
The problem every fund recognises
A portfolio built by acquisition rarely shares anything. One business runs Xero, one runs Sage, one runs Business Central, one runs NetSuite. They have different charts of accounts, different cost centres, sometimes different year ends and currencies. Each sends a monthly management pack in its own layout, and somebody at the fund spends the first week of every month re-typing them into a spreadsheet so the investment committee can compare like with like.
That spreadsheet is the fund's single view. It is late, it depends on one person, and nobody can drill from a number back to the transactions behind it.
What the platform has to do
Extract from each ledger without asking the company to change it. Xero, Sage, Business Central and NetSuite all have APIs or connectors. The extraction lands each company's trial balance and, where it matters, transaction detail into a lakehouse on a schedule.
Map to one reporting chart. This is the step that decides whether the numbers can be compared. Every account in every company is mapped to a line in the fund's reporting chart: revenue, cost of sales, overheads by type, EBITDA adjustments, below-the-line items. The mapping is a maintained table, owned by someone in the fund's finance team, not logic hidden in a report.
Agree the definitions once. What counts as an EBITDA adjustment, how like-for-like revenue is measured, how cash conversion is calculated. These are written down and built into the model, so the board, the portfolio company and the lender all see the same number for the same reason.
Handle currency and calendars. Companies that report in euro are translated at the agreed rates, and companies with different year ends are aligned to the fund's reporting months.
Show each audience what it should see. The fund sees everything. Each portfolio company's management sees its own business against its plan. Lenders see the covenant measures. Row-level security in the model controls that, from one set of numbers.
Where it pays back
The first payback is time: the month-end re-keying stops. The second is earlier warning, because the fund sees trading weekly or daily rather than three weeks after month end. The third is at the value-creation stage, when the same model can compare procurement, pricing or labour cost across companies and show where a group-wide change would earn most.
On Microsoft's stack we build this on Microsoft Fabric with Power BI on top. A first version with two or three portfolio companies and a monthly pack typically follows a four-week Establish phase and an 8 to 12 week build; each company added after that is mostly mapping work.
Where to start
Start with the investment committee pack you already produce. Map the companies that make up most of the fund's value, prove that the model reproduces last quarter's numbers, and only then add weekly trading data and the rest of the portfolio. Our Strategy and Leadership page describes how we scope that first phase.
Related reading
The hidden cost of manual reporting
Why Power BI reports show different numbers, and how to fix it
Measuring the return on analytics
Simon Devine
Managing Director
Part of the Hopton Analytics team, delivering governed analytics programmes for UK mid-market organisations.